. 2012;7(9):e45972.
doi: 10.1371/journal.pone.0045972. Epub 2012 Sep 26.

Increased cortical-limbic anatomical network connectivity in major depression revealed by diffusion tensor imaging

Affiliations

Increased cortical-limbic anatomical network connectivity in major depression revealed by diffusion tensor imaging

Peng Fang et al. PLoS One. 2012.

Abstract

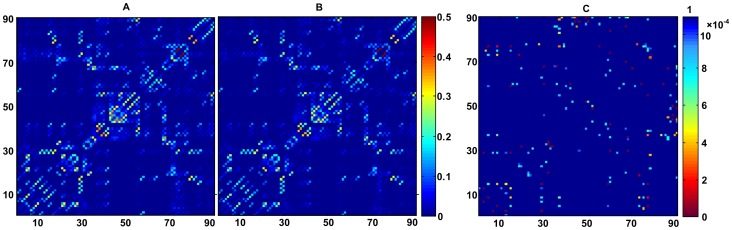
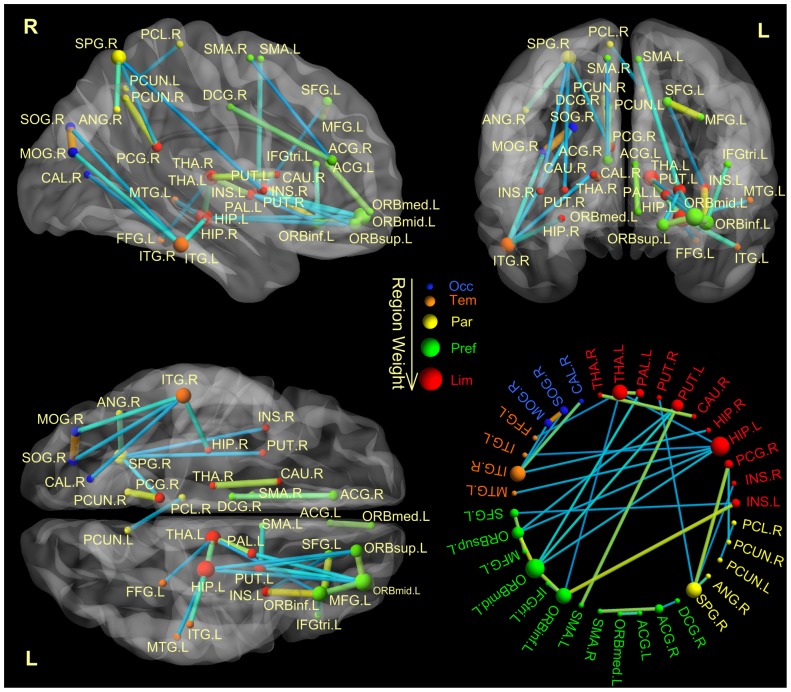
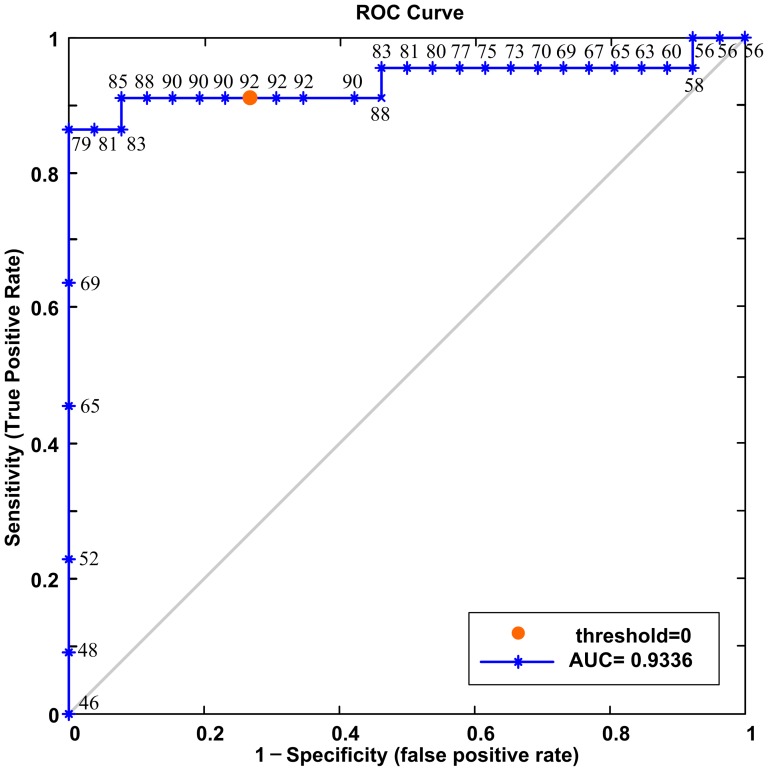
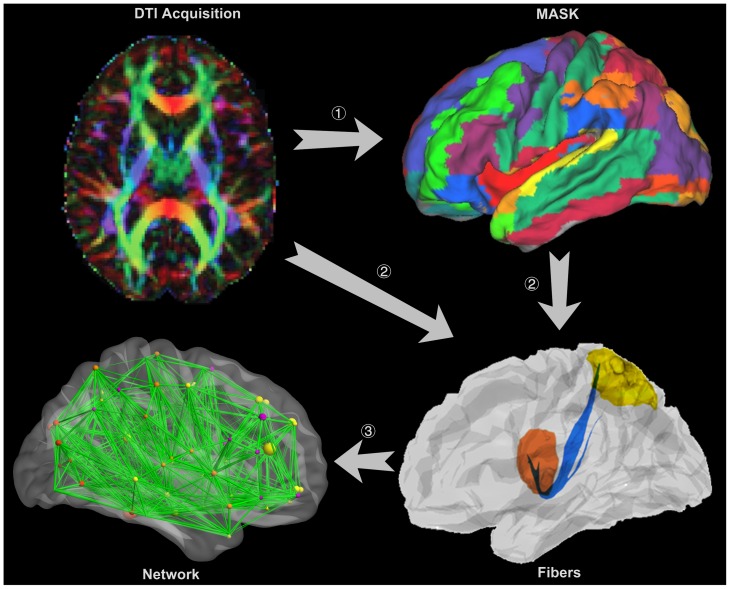
Magnetic resonance imaging studies have reported significant functional and structural differences between depressed patients and controls. Little attention has been given, however, to the abnormalities in anatomical connectivity in depressed patients. In the present study, we aim to investigate the alterations in connectivity of whole-brain anatomical networks in those suffering from major depression by using machine learning approaches. Brain anatomical networks were extracted from diffusion magnetic resonance images obtained from both 22 first-episode, treatment-naive adults with major depressive disorder and 26 matched healthy controls. Using machine learning approaches, we differentiated depressed patients from healthy controls based on their whole-brain anatomical connectivity patterns and identified the most discriminating features that represent between-group differences. Classification results showed that 91.7% (patients=86.4%, controls=96.2%; permutation test, p<0.0001) of subjects were correctly classified via leave-one-out cross-validation. Moreover, the strengths of all the most discriminating connections were increased in depressed patients relative to the controls, and these connections were primarily located within the cortical-limbic network, especially the frontal-limbic network. These results not only provide initial steps toward the development of neurobiological diagnostic markers for major depressive disorder, but also suggest that abnormal cortical-limbic anatomical networks may contribute to the anatomical basis of emotional dysregulation and cognitive impairments associated with this disease.


Conflict of interest statement

Competing Interests: The authors have declared that no competing interests exist.

Figures

Figure 1
Figure 1. Mean connectivity strength matrix and significance matrix across populations.
A: mean connectivity strength matrix of depressed patients. B: mean connectivity strength matrix of healthy controls. C: significance matrix, representing t-statistics for the significance of any differences across populations for all connections. Left color bar represents connectivity strength, while right color bar represents p-value. Results are indexed in 90×90 matrices. Symmetry is enforced.
Figure 2
Figure 2. Region weights and distribution of the consensus anatomical connections.
The consensus anatomical connections are displayed both on a surface rendering of the brain and in a circle. The thickness of connections adjusts according to their connectivity strength. The connectivity for either low or high values is color-coded in blue and orange. The diameter of a sphere represents the corresponding region weight of a ROI. The ROIs are color-coded according to brain areas (red, limbic cortex; green, prefrontal cortex; yellow, parental cortex; orange, temporal cortex; blue, occipital cortex). R = right hemisphere, L = left hemisphere. SFG = Superior Frontal; ORBsup = Superior Orbital Frontal; MFG = Middle Frontal; ORBmid = Middle Orbital Frontal; IFGtriang = Inferior Triangular Frontal; ORBinf = Inferior Orbital Frontal; SMA = Supplementary Motor Area; ORBsupmed = Medial Orbital Frontal; INS = Insula; ACG = Anterior Cingulate; DCG = Middle Cingulate; PCG = Posterior Cingulate; HIP = Hippocampus; CAL = Calcarine; SOG = Superior Occipital; MOG = Superior Occipital; FFG = Fusiform; SPG = Superior Parietal; ANG = Angular; PCUN = Precuneus; PCL = Paracentral Lobule; CAU = Caudate; PUT = Putamen; PAL = Pallidum; THA = Thalamus; MTG = Middle Temporal; ITG = Inferior Temporal. Brain networks are visualized using the BrainNet Viewer (http://www.nitrc.org/projects/bnv/).
Figure 3
Figure 3. ROC curve of SVM classifier.
Numbers around the curve are the correct classification rates (%) corresponding to different sensitivities and specificities. A circular orange point on the curve corresponds to the classification rate, with zero as the classification threshold.
Figure 4
Figure 4. Extraction of a whole brain anatomical network.
The DTI image is presented in a reconstructed color-coded tensor map, showing the direction of the principal axis of diffusion using the standard scheme. Blue codes for the superior-inferior, red for left-right, and green for anterior-posterior orientation. (1) Cortical parcellation. The DTI images are mapped with an AAL atlas in the diffusion-MRI native space. (2) Fiber tractography between ROIs. Probabilistic tractography is performed between two ROIs defined in step (1), with only direct connections being retained. (3) Whole brain anatomical network construction. All of the connections in step (2) constitute the whole brain anatomical network.

References

    1. Drevets WC, Price JL, Furey ML (2008) Brain structural and functional abnormalities in mood disorders: implications for neurocircuitry models of depression. Brain Struct Funct 213: 93–118. - PMC - PubMed
    1. Bae JN, Macfall JR, Krishnan KR, Payne ME, Steffens DC, et al. (2006) Dorsolateral prefrontal cortex and anterior cingulate cortex white matter alterations in late-life depression. Biol Psychiatry 60: 1356–1363. - PubMed
    1. Drevets WC, Price JL, Bardgett ME, Reich T, Todd RD, et al. (2002) Glucose metabolism in the amygdala in depression: relationship to diagnostic subtype and plasma cortisol levels. Pharmacol Biochem Behav 71: 431–447. - PubMed
    1. Videbech P, Ravnkilde B, Pedersen AR, Egander A, Landbo B, et al. (2001) The Danish PET/depression project: PET findings in patients with major depression. Psychol Med 31: 1147–1158. - PubMed
    1. Chen CH, Ridler K, Suckling J, Williams S, Fu CHY, et al. (2007) Brain imaging correlates of depressive symptom severity and predictors of symptom improvement after antidepressant treatment. Biol Psychiatry 62: 407–414. - PubMed

Publication types