. 2012;7(9):e46086.
doi: 10.1371/journal.pone.0046086. Epub 2012 Sep 26.

Validation of the Cancer BioChip System as a 3D siRNA screening tool for breast cancer targets

Affiliations

Validation of the Cancer BioChip System as a 3D siRNA screening tool for breast cancer targets

Joie N Marhefka et al. PLoS One. 2012.

Abstract

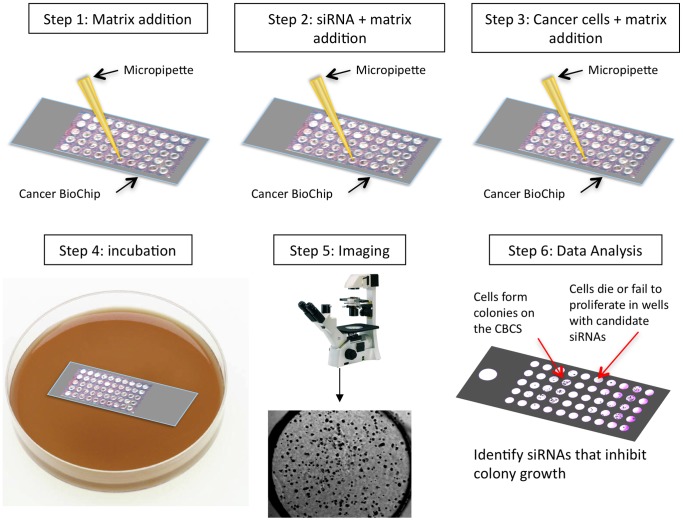
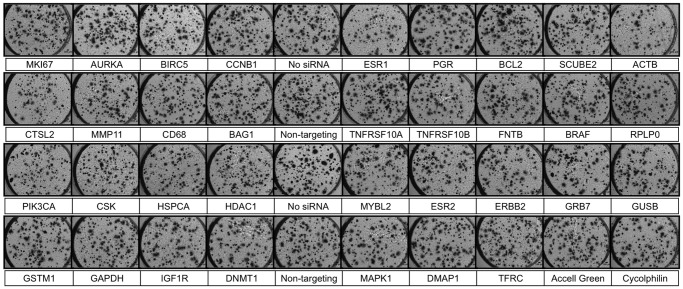
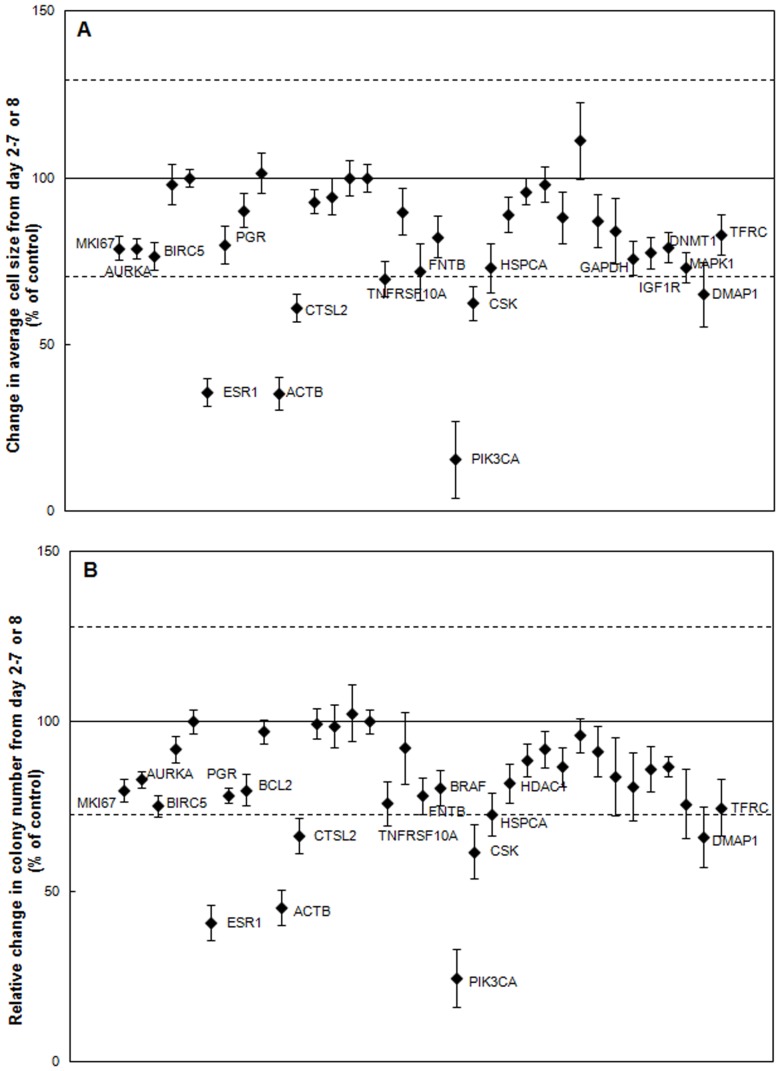
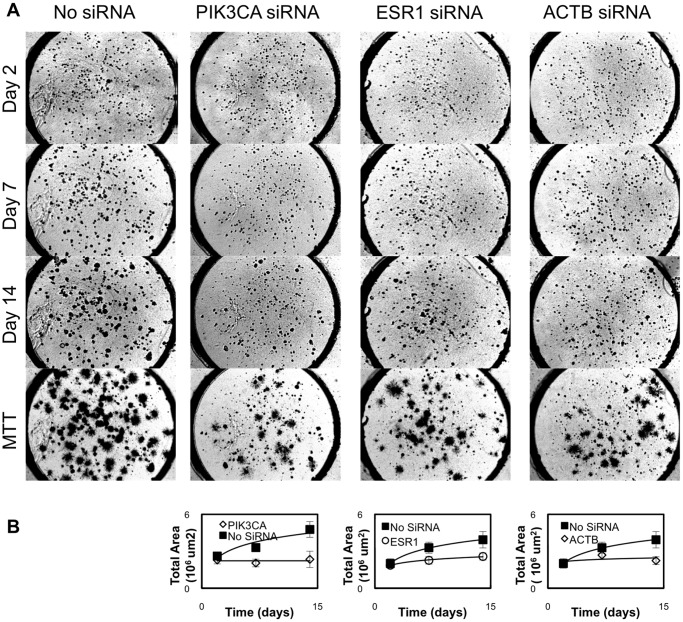
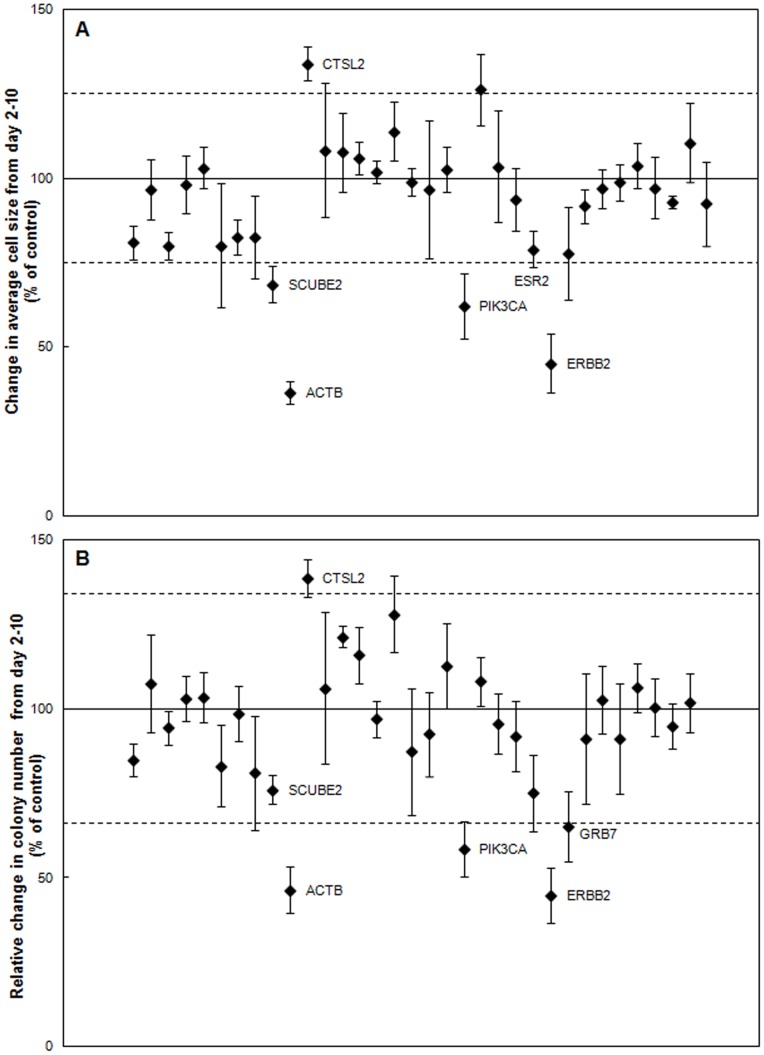
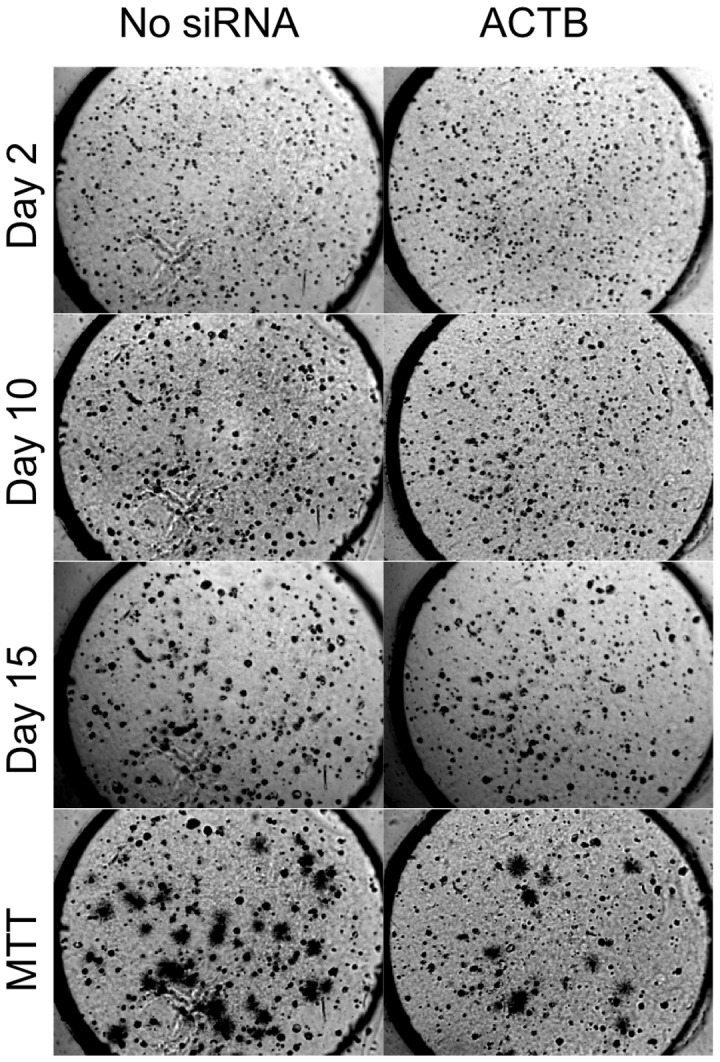
Genomic studies have revealed that breast cancer consists of a complex biological process with patient-specific genetic variations, revealing the need for individualized cancer diagnostic testing and selection of patient-specific optimal therapies. One of the bottlenecks in translation of genomic breakthroughs to the clinic is the lack of functional genomic assays that have high clinical translatability. Anchorage-independent three-dimensional (3D) growth assays are considered to be the gold-standard for chemosensitivity testing, and leads identified with these assays have high probability of clinical success. The Cancer BioChip System (CBCS) allows for the simultaneous, quantitative, and real time evaluation of multitudes of anchorage-independent breast cancer cell growth inhibitors. We employed a Test Cancer BioChip that contains silencing RNAs (siRNAs) targeting cancer-related genes to identify 3D-specific effectors of breast cancer cell growth. We compared the effect of these siRNAs on colony growth of the hormone receptor positive (MCF7) and Human Epidermal Growth Factor Receptor 2/c- Erythroblastic Leukemia Viral Oncogene Homolog 2 (HER2/c-erb-b2) positive (SK-BR-3) cells on the Test Cancer BioChip. Our results confirmed cell-specific inhibition of MCF7 and SK-BR-3 colony formation by estrogen receptor α (ESR1) and (ERBB2) siRNA, respectively. Both cell lines were also suppressed by Phosphoinositide-3-kinase Catalytic, alpha Polypeptide (PIK3CA) siRNA. Interestingly, we have observed responses to siRNA that are unique to this 3D setting. For example, ß-actin (ACTB) siRNA suppressed colony growth in both cell types while Cathepsin L2 (CTSL2) siRNA caused opposite effects. These results further validate the importance of the CBCS as a tool for the identification of clinically relevant breast cancer targets.


Conflict of interest statement

Competing Interests: This work was performed at Falcon Genomics, Inc. laboratories in Pittsburgh, PA. All authors are employed by Falcon Genomics, Inc. The authors declare that the Cancer BioChip system is covered under U.S. Patents # 7,537,913 B2 and 8,110,375 B2, U.S. Patent applications # 13/441,855 and 61/473,222, Canadian Patent application # 2,593,494, and PCT international application # PCT/US12/32664. The Cancer BioChip system was used as a tool in completing this study. This does not alter the authors' adherence to all the PLOS ONE policies on sharing data and materials.

Figures

Figure 1
Figure 1. Steps involved in the development of the first-generation Test Cancer BioChip.
Shown is the first-generation Cancer BioChip (CBC-1) that is capable of testing the effect of 50 individual siRNAs on colony growth in soft agar. For this study, four CBC-1 were used for screening 40 siRNAs including positive and negative controls. After addition of base agar (step 1), the siRNA was mixed with agar and applied in each well (step 2) followed by cells that were also embedded in agar (step 3). The CBC-1 was fed with medium after a 24-hour incubation (step 4) and growth of colonies was monitored at different time points thereafter using an inverted microscope (step 5). Microscopic image analysis allows for identification of siRNAs that affected colony growth (step 6).
Figure 2
Figure 2. Representative images showing MCF7 colonies growing on the Test Cancer BioChip in presence of individual siRNAs.
Cells were stained with MTT after 15 days on the CBC-1. Live colonies take up the dye and thus appear dark and slightly larger due to the formation of formazan crystals. Each well is 3 mm in diameter.
Figure 3
Figure 3. Identification of inhibitors of MCF7 cell growth on the CBC-1.
A) Change in average MCF7 cell size from day 2–7 or 8 normalized to control (n = 6–11). B) Relative change in MCF7 colonies between day 2–7 or 8 normalized to control (n = 6–11). Labeled siRNAs are significantly different from control in A & B (p<0.05). Dashed lines represent two standard deviations away from the control mean.
Figure 4
Figure 4. Time course of MCF7 colony suppression by PIK3CA, ESR1, and ACTB siRNA as compared to control no siRNA on the CBC-1.
A) Representative images showing MCF7 colony formation over time in the presence of no siRNA, PIK3CA, ESR1, and ACTB siRNA. Live colonies are stained in the MTT images (stained on day 14) and appear dark and slightly larger due to the formation of formazan crystals. Each well is 3 mm in diameter. B) Growth curves show the change in total area covered by cells vs. time for these siRNAs and illustrate significant suppression caused by PIK3CA, ESR1, and ACTB siRNAs.
Figure 5
Figure 5. Identification of inhibitors of SK-BR-3 cell growth on the CBC-1.
A) Change in average SK-BR-3 cell size from day 2–10 normalized to control (n = 3–5). B) Relative change in SK-BR-3 colonies between day 2–10 normalized to control (n = 3–5). Labeled siRNAs are significantly different from control in A & B (p<0.05). Dashed lines represent two standard deviations away from the control mean.
Figure 6
Figure 6. Representative images showing the suppression of SK-BR-3 cell growth over time caused by ACTB siRNA.
Live colonies were stained with MTT on day 15. Each well is 3 mm in diameter.

References

    1. Schlabach MR, Luo J, Solimini NL, Hu G, Xu Q, et al. (2008) Cancer proliferation gene discovery through functional genomics. Science 319: 620–624. - PMC - PubMed
    1. Silva JM, Marran K, Parker JS, Silva J, Golding M, et al. (2008) Profiling essential genes in human mammary cells by multiplex RNAi screening. Science 319: 617–620. - PMC - PubMed
    1. Bauer JA, Ye F, Marshall CB, Lehmann BD, Pendleton CS, et al. (2010) RNA interference (RNAi) screening approach identifies agents that enhance paclitaxel activity in breast cancer cells. Breast Cancer Res 12: R41. - PMC - PubMed
    1. Berns K, Horlings HM, Hennessy BT, Madiredjo M, Hijmans EM, et al. (2007) A functional genetic approach identifies the PI3K pathway as a major determinant of trastuzumab resistance in breast cancer. Cancer Cell 12: 395–402. - PubMed
    1. Iorns E, Lord CJ, Ashworth A (2009) Parallel RNAi and compound screens identify the PDK1 pathway as a target for tamoxifen sensitization. Biochem J 417: 361–370. - PubMed

Publication types