

Gene-wide characterization of common quantitative trait loci for ABCB1 mRNA expression in normal liver tissues in the Chinese population
- PMID: 23050008
- PMCID: PMC3458811
- DOI: 10.1371/journal.pone.0046295
Gene-wide characterization of common quantitative trait loci for ABCB1 mRNA expression in normal liver tissues in the Chinese population
Abstract
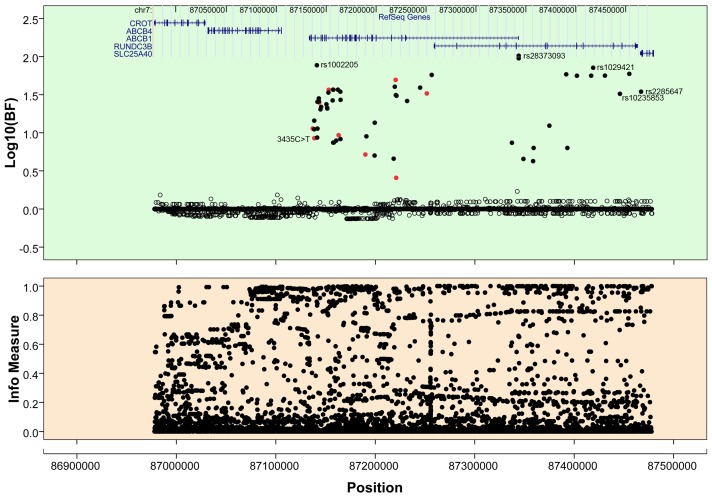
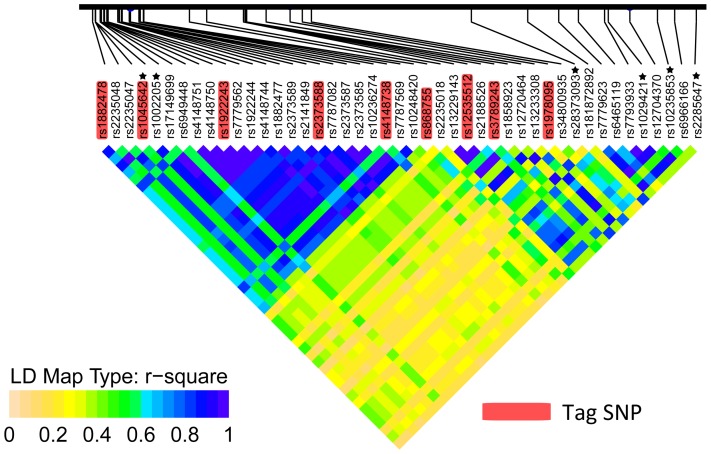
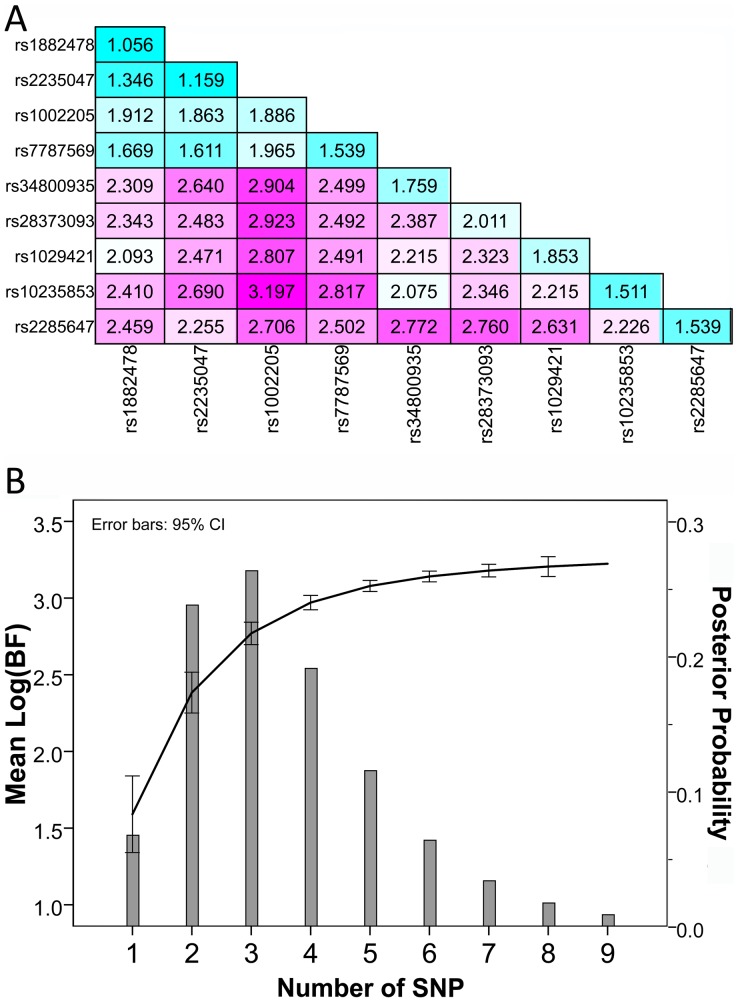
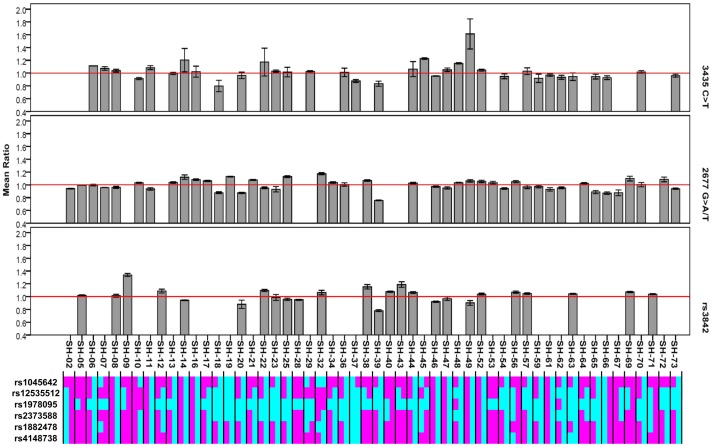
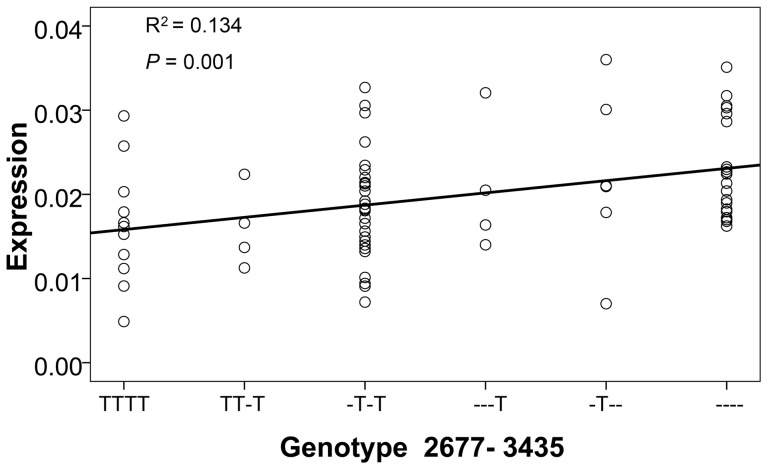
In order to comprehensively screen genetic variants leading to differential expression of the important human ABCB1 gene in the primary drug-metabolizing organ, ABCB1 mRNA expression levels were measured in 73 normal liver tissue samples from Chinese subjects. A set of Tag SNPs. were genotyped. In addition, imputation was performed within a 500 kb region around the ABCB1 gene using the reference panels of 1,000 Genome project and HapMap III. Bayesian regression was used to assess the strength of associations by compute Bayes Factors for imputed SNPs. Through imputation and linkage disequilibrium analysis, the imputed loci rs28373093, rs1002205, rs1029421, rs2285647, and rs10235835, may represent independent and strong association signals. rs28373093, a polymorphism 1.5 kb upstream from the ABCB1 transcription start site, has the strongest association. 2677 G>A/T and 3435C>T confer a clear gene-dosage effect on ABCB1 mRNA expression. The systematic characterization of gene-wide common quantitative trait loci associated with ABCB1 mRNA expression in normal liver tissues would provide the candidate markers to ABCB1-relevant clinical phenotypes in Chinese population.
Conflict of interest statement
Figures
Similar articles
-
Gene-wide tagging study of association between ABCB1 polymorphisms and multidrug resistance in epilepsy in Han Chinese.Pharmacogenomics. 2009 May;10(5):723-32. doi: 10.2217/pgs.09.32. Pharmacogenomics. 2009. PMID: 19450124
-
ABCB1 gene polymorphisms and haplotype analysis in colorectal cancer.Int J Colorectal Dis. 2009 Aug;24(8):895-905. doi: 10.1007/s00384-009-0724-0. Epub 2009 May 5. Int J Colorectal Dis. 2009. PMID: 19415305
-
ABCC2 polymorphisms and haplotype are associated with drug resistance in Chinese epileptic patients.CNS Neurosci Ther. 2012 Aug;18(8):647-51. doi: 10.1111/j.1755-5949.2012.00336.x. Epub 2012 May 28. CNS Neurosci Ther. 2012. PMID: 22630058 Free PMC article.
-
Effect of CYP3A and ABCB1 single nucleotide polymorphisms on the pharmacokinetics and pharmacodynamics of calcineurin inhibitors: Part I.Clin Pharmacokinet. 2010 Mar;49(3):141-75. doi: 10.2165/11317350-000000000-00000. Clin Pharmacokinet. 2010. PMID: 20170205 Review.
-
ABCB1 c.3435C > T and EPHX1 c.416A > G polymorphisms influence plasma carbamazepine concentration, metabolism, and pharmacoresistance in epileptic patients.Gene. 2021 Dec 30;805:145907. doi: 10.1016/j.gene.2021.145907. Epub 2021 Aug 16. Gene. 2021. PMID: 34411648 Review.
Cited by
-
Impact of Genetic Polymorphisms of ABCB1 (MDR1, P-Glycoprotein) on Drug Disposition and Potential Clinical Implications: Update of the Literature.Clin Pharmacokinet. 2015 Jul;54(7):709-35. doi: 10.1007/s40262-015-0267-1. Clin Pharmacokinet. 2015. PMID: 25860377 Review.
-
Drug metabolism and transport gene polymorphisms and efavirenz adverse effects in Brazilian HIV-positive individuals.J Antimicrob Chemother. 2018 Sep 1;73(9):2460-2467. doi: 10.1093/jac/dky190. J Antimicrob Chemother. 2018. PMID: 29868865 Free PMC article.
-
Association of Genetic Polymorphisms With Afatinib-induced Diarrhoea.In Vivo. 2020 May-Jun;34(3):1415-1419. doi: 10.21873/invivo.11922. In Vivo. 2020. PMID: 32354939 Free PMC article.
-
Possible association of ABCB1:c.3435T>C polymorphism with high-density-lipoprotein-cholesterol response to statin treatment--a pilot study.Bosn J Basic Med Sci. 2014 Aug 14;14(3):144-9. doi: 10.17305/bjbms.2014.3.43. Bosn J Basic Med Sci. 2014. PMID: 25172973 Free PMC article.
-
The effect of CHRNA3 rs1051730 C>T and ABCB1 rs3842 A>G polymorphisms on non-small cell lung cancer and nicotine dependence in Iranian population.Heliyon. 2021 Aug 24;7(9):e07867. doi: 10.1016/j.heliyon.2021.e07867. eCollection 2021 Sep. Heliyon. 2021. PMID: 34522797 Free PMC article.
References
-
- Sakaeda T, Nakamura T, Okumura K (2003) Pharmacogenetics of MDR1 and its impact on the pharmacokinetics and pharmacodynamics of drugs. Pharmacogenomics 4 (4) 397–410. - PubMed
-
- Marzolini C, Paus E, Buclin T, Kim RB (2004) Polymorphisms in human MDR1 (P-glycoprotein): recent advances and clinical relevance. Clin Pharmacol Ther 75 (1) 13–33. - PubMed
-
- Schinkel AH (1997) The physiological function of drug-transporting P-glycoproteins. Semin Cancer Biol 8 (3) 161–170. - PubMed
-
- Tanigawara Y (2000) Role of P-glycoprotein in drug disposition. Ther Drug Monit 22 (1) 137–140. - PubMed
Publication types
MeSH terms
Substances
LinkOut - more resources
Full Text Sources
