. 2012 Oct;6(5):380-396.
doi: 10.1007/s12170-012-0260-2.

Cognition and Hemodynamics

Affiliations

Cognition and Hemodynamics

Vera Novak. Curr Cardiovasc Risk Rep. 2012 Oct.

Abstract

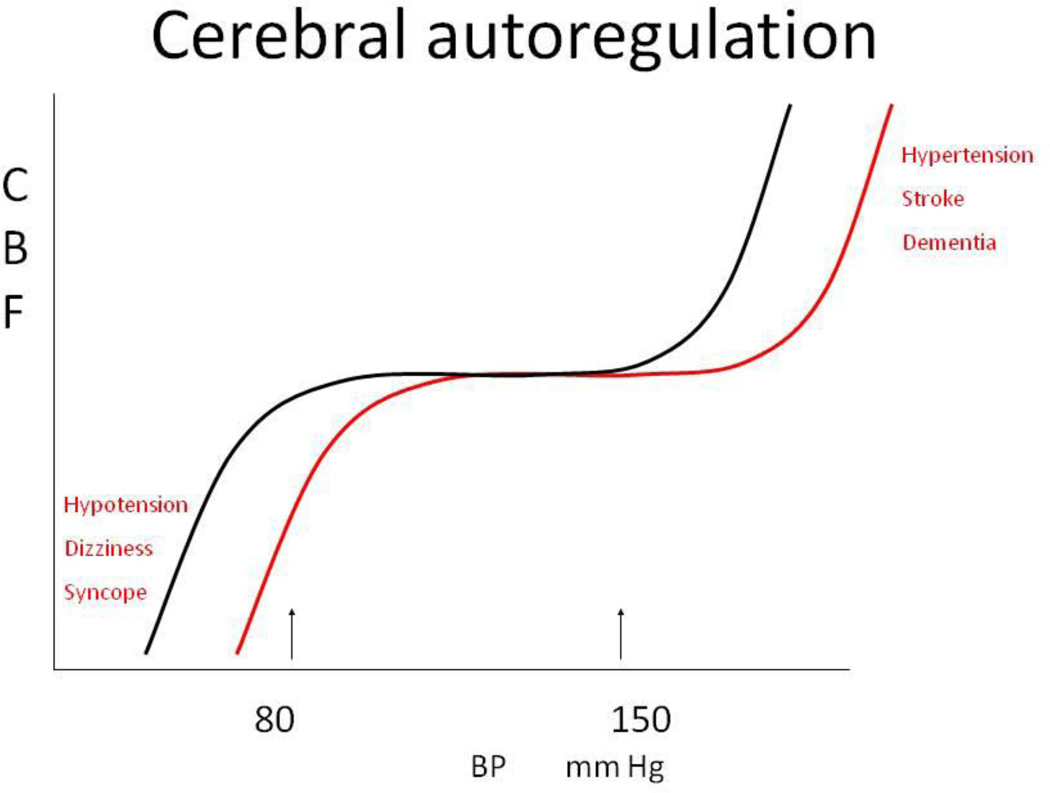
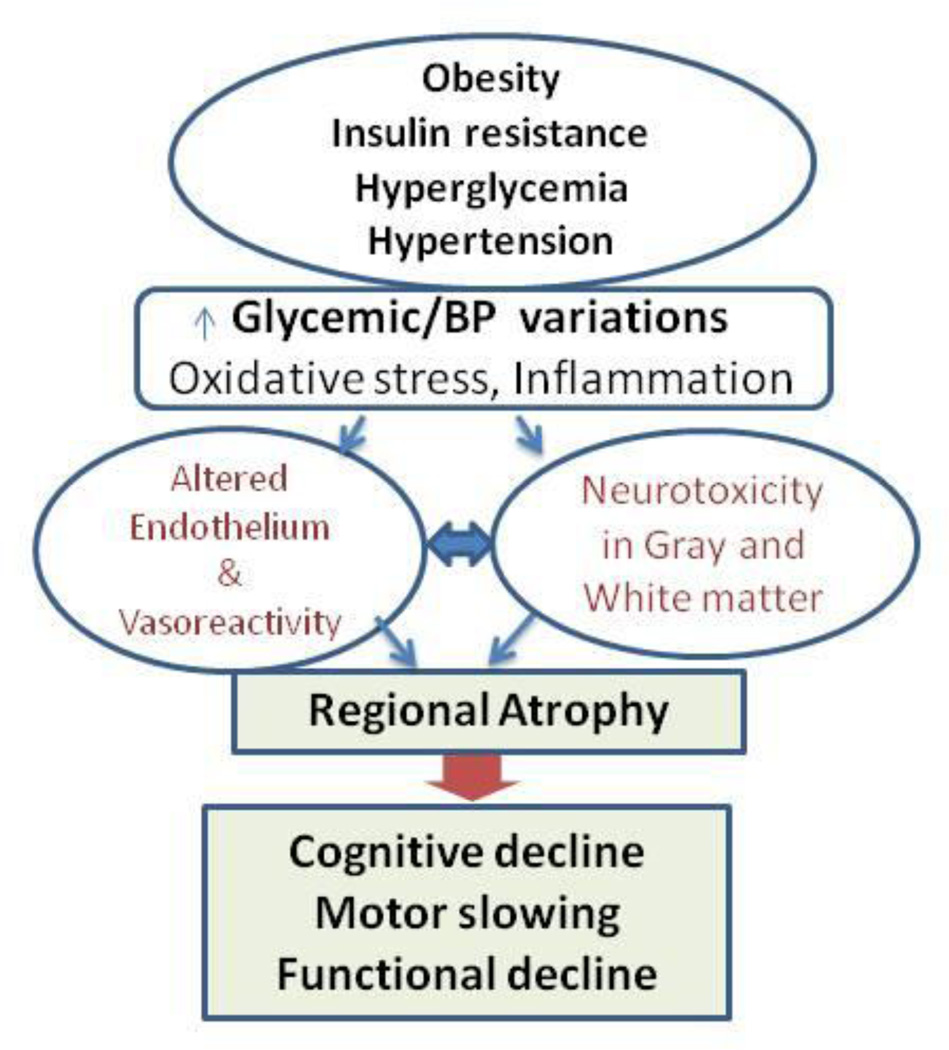
The relationship between cerebral hemodynamics and cognitive performance has increasingly become recognized as a major challenge in clinical practice for older adults. Both diabetes and hypertension worsen brain perfusion and are major risk factors for cerebrovascular disease, stroke and dementia. Cerebrovascular reserve has emerged as a potential biomarker for monitoring pressure-perfusion-cognition relationships. Endothelial dysfunction and inflammation, microvascular disease, and mascrovascular disease affect cerebral hemodynamics and play an important role in pathohysiology and severity of multiple medical conditions, presenting as cognitive decline in the old age. Therefore, the identification of cerebrovascular vascular reactivity as a new therapeutic target is needed for prevention of cognitive decline late in life.


Conflict of interest statement

Disclosure: No potential conflicts of interest relevant to this article were reported.

Figures

Figure 1
Figure 1
Cerebral autoregulation curve- denotes the normal range of pressure -flow regulation (black line) and a right shift of the autoregulation curve toward higher BP values, associated with hypertension (red line).
Figure 2
Figure 2
High resolution anatomical images obtained using 8Tesla MRI, a 45-year-old woman with a small vessel disease. Rapid acquisition with relaxation enhancement (RARE) images (A, B, C) at the level of ventricles showed confluent white matter hyperintensities (WMHs) extending from the anterior and posterior horns of the ventricles (white arrows). Additional focal areas of high signal intensity were seen in the periventricular white matter and basal ganglia. 8T GE images (D, E, F) showed normal pattern of microvasculature as signal voids (black arrows).(GE: BW=69.4 kHz, FOV=20×20cm, slice thickness 2.3 mm, TR=600 ms, TE=10 ms, matrix 1024 × 1024; RARE: BW=69.4 kHz, FOV=20 × 20 cm2, slice thickness 2 mm, TR=3000 ms, TE=22 ms, matrix 512 × 512, RARE factor 4). (Reproduced with permission from: Novak V, Christiforidis G: Clinical promise. In: Robitaille PM, Berliner LJ, editors. Ultra high field magnetic resonance imaging (UHFMRI): Theory and applications, biological magnetic resonance. A series of contemporary topics and reviews. (With permission from: Novak V. Clinical Promise: Clinical Imaging at Ultra High Field. 2007; 26(13): 411–437) [77].
Figure 3
Figure 3
A conceptual model of pathways that link cardiovascular risk factors (obesity, insulin resistance, chronic hyperglycemia and hypertension) with metabolic and autonomic dysregulation of arterial pressure and glucose, leading to increased oxidative stress and vascular inflammation. Their additive effects alter neurovascular coupling and vasoreactivity, leading to brain atrophy and functional decline.
Figure 4
Figure 4
Anatomical images of a diabetic (A1–A5) and a control subject (B1–B5) demonstrate that type 2 diabetes is associated with atrophy of gray (GM) and white matter (WM), enlarged ventricles) and diffuse periventricular hyperintensities (WMHs). 3D Magnetization prepared rapid gradient echo (MP_RAGE) and fluid attenuated inversion recovery (FLAIR) images were acquired at 3 Tesla MRI (MP_RAGE: TR/TE/TI = 7.8/3.1/600 ms, 3.0 mm slice thickness, 52 slices, bandwidth = 122 Hz per pixel, flip angle = 10°, 24 cm × 24 cm FOV, 256 × 192 matrix size), FLAIR (TR/TE/TI = 11000/161/2250 ms, 5 mm slice thickness, 30 slices, bandwidth = 122 Hz per pixel, flip angle = 90°, 24 cm × 24 cm FOV, 256 × 160 matrix size).

References

    1. Pereira M, Lunet N, Azevedo A, Barros H. Differences in prevalence, awareness, treatment and control of hypertension between developing and developed countries. J Hypertens. 2009;27:963–975. Distribution and impact of hypertension worldwide.

    1. Rutan GH, Hermanson B, Bild DE, Kittner SJ, LaBaw F, Tell GS. Orthostatic hypotension in older adults. The Cardiovascular Health Study. CHS Collaborative Research Group. Hypertension. 1992;19:508–519. - PubMed
    1. Wild S, Roglic G, Green A, Sicree R, King H. Global prevalence of diabetes: estimates for the year 2000 and projections for 2030. Diabetes Care. 2004;27:1047–1053. - PubMed
    1. Whiting DR, Guariguata L, Weil C, Shaw J. IDF diabetes atlas: global estimates of the prevalence of diabetes for 2011 and 2030. Diabetes Res Clin Pract. 2011;94:311–321. - PubMed
    1. Kearney PM, Whelton M, Reynolds K, Muntner P, Whelton PK, He J. Global burden of hypertension: analysis of worldwide data. Lancet. 2005;365:217–223. - PubMed

LinkOut - more resources