. 2012 Oct 31;134(43):17945-54.
doi: 10.1021/ja3055782. Epub 2012 Oct 19.

Transient B12-dependent methyltransferase complexes revealed by small-angle X-ray scattering

Affiliations
Free PMC article

Transient B12-dependent methyltransferase complexes revealed by small-angle X-ray scattering

Nozomi Ando et al. J Am Chem Soc. .
Free PMC article

Abstract

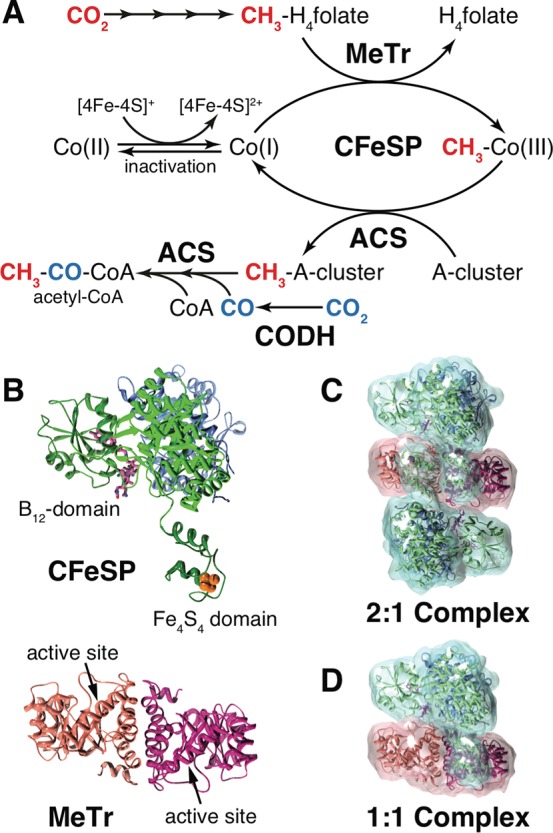
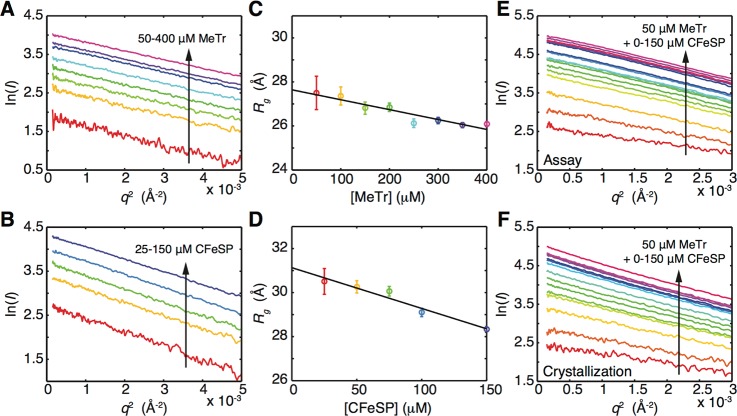
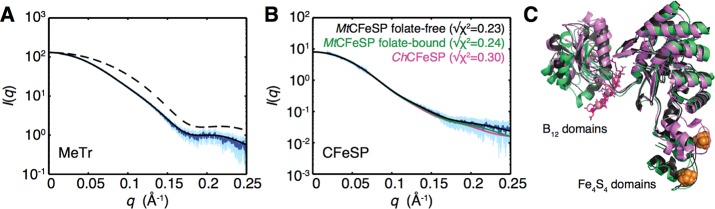
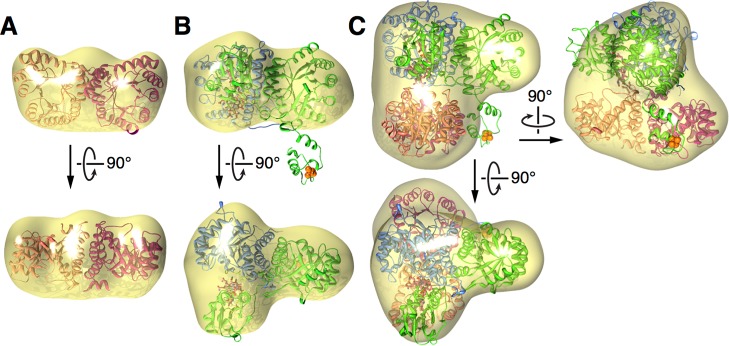
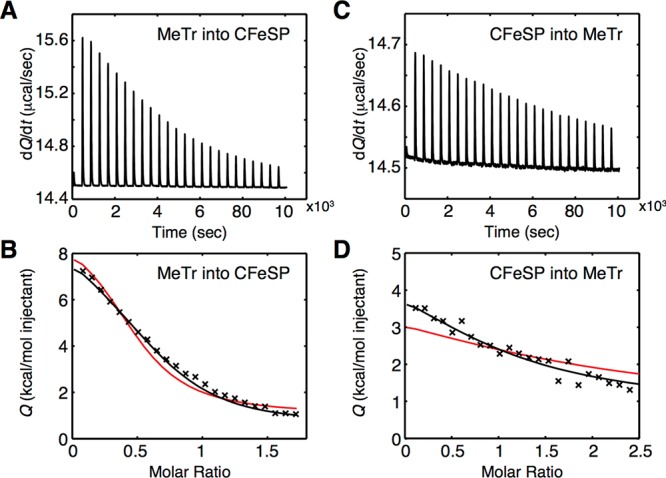
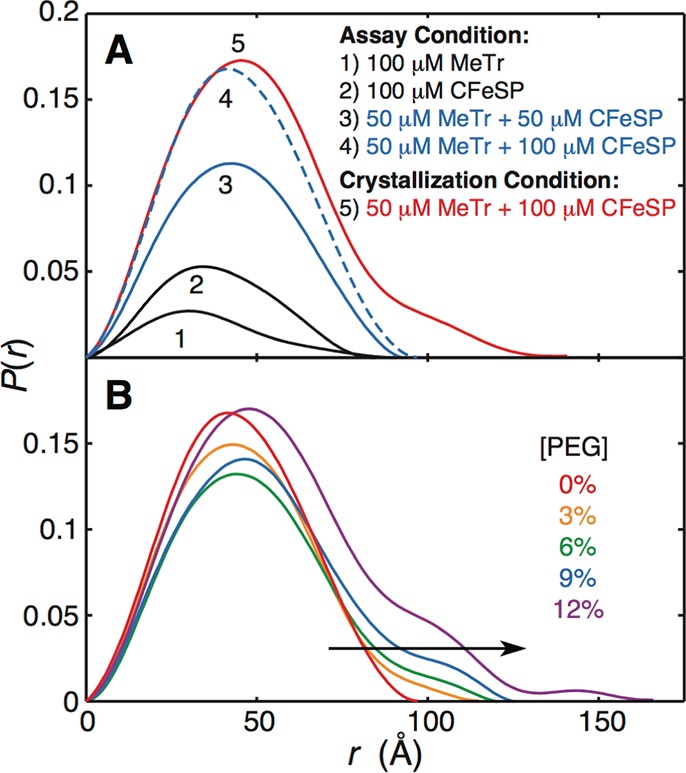
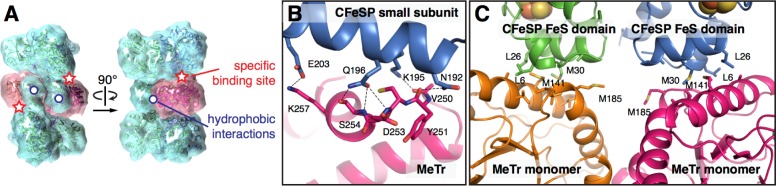
In the Wood-Ljungdahl carbon fixation pathway, protein-protein interactions between methyltransferase (MeTr) and corrinoid iron-sulfur protein (CFeSP) are required for the transfer of a methyl group. While crystal structures have been determined for MeTr and CFeSP both free and in complex, solution structures have not been established. Here, we examine the transient interactions between MeTr and CFeSP in solution using anaerobic small-angle X-ray scattering (SAXS) and present a global analysis approach for the deconvolution of heterogeneous mixtures formed by weakly interacting proteins. We further support this SAXS analysis with complementary results obtained by anaerobic isothermal titration calorimetry. Our results indicate that solution conditions affect the cooperativity with which CFeSP binds to MeTr, resulting in two distinct CFeSP/MeTr complexes with differing oligomeric compositions, both of which are active. One assembly resembles the CFeSP/MeTr complex observed crystallographically with 2:1 protein stoichiometry, while the other best fits a 1:1 CFeSP/MeTr arrangement. These results demonstrate the value of SAXS in uncovering the rich solution behavior of transient protein interactions visualized by crystallography.


Figures

Figure 1
Figure 1
CFeSP and MeTr in the Wood–Ljungdahl carbon fixation pathway. (A) One molecule of CO2 (red) is reduced to a methyl group in a series of folate-dependent reactions, catalyzed by five enzymes, to produce CH3-H4folate, the substrate of MeTr. MeTr and B12-containing CFeSP form a complex to transfer the methyl group to the Co(I) center of the B12 cofactor, forming a CH3–Co(III) intermediate. CFeSP then delivers the methyl group to the Ni–Fe–S A-cluster of ACS, reducing the B12 cobalt back to the Co(I) state. ACS subsequently catalyzes formation of acetyl-CoA by combining the methyl group with CoA and CO, itself derived from a second molecule of CO2 (blue) by the action of carbon monoxide dehydrogenase (CODH). Intermittent oxidation of the reactive Co(I) state of B12 causes inactivation to the Co(II) state. CFeSP can be reactivated by an electron that is transferred from the CFeSP Fe4S4 cluster to the B12 cobalt. (B) CFeSP is a heterodimer of a small (light blue) and a large (green) subunit consisting of a B12, central, and Fe4S4 domain. MeTr is a homodimer (pink/magenta), with each monomer containing a CH3-H4folate binding site., (C) Crystal structures of CFeSP/MeTr in complex exhibit 2:1 stoichiometry, with CFeSP (cyan) making equivalent interactions on either side of MeTr (pink). (D) A model for a CFeSP/MeTr complex with 1:1 stoichiometry can be generated by removing one CFeSP from the structure shown in (C).
Figure 2
Figure 2
Guinier analysis of MeTr and CFeSP on their own and mixed. (A) Guinier plot of 50–400 μM MeTr under assay conditions. (B) Guinier plot of 25–150 μM CFeSP under assay conditions. (C,D) The corresponding radii of gyration (Rg) determined from the slopes of the Guinier plots are linear with respect to protein concentration. Linear extrapolation to infinite dilution gives Rg values of 27.6 ± 0.4 and 31.1 ± 0.7 Å for MeTr and CFeSP, respectively, in good agreement with theoretical values determined from crystal structures., (E) Guinier plot for the CFeSP titration (0–150 μM) into MeTr homodimer (fixed at 50 μM) under assay conditions. (F) Guinier plot for same titration as in (E) but under crystallization conditions. All Guinier plots show linearity in this low q range.
Figure 3
Figure 3
Model fitting to the scattering of free MeTr and CFeSP under assay conditions. (A) The theoretical profile (black solid) of the homodimeric M. thermoacetica MeTr crystal structure fits well to experimental data obtained from 470 μM MeTr (dark blue with error bars shown in cyan), while that of just one MeTr monomer (black dashed) gives a poor fit. (B) Theoretical profiles of the three CFeSP models (shown in C, with same coloring) are nearly superimposable with each other at 25 Å resolution (i.e., q < 0.25 Å–1). MtCFeSP from the folate-free structure provides the best fit (lowest √χ2) to the experimental curve (dark blue with error bars shown in cyan) obtained by merging low q data from 19 μM CFeSP, which exhibited minimal interparticle effects, and high q data from 230 μM CFeSP. (C) Crystal structures depict CFeSP in three different conformational states: M. thermoacetica CFeSP (MtCFeSP) extracted from structures of CFeSP/MeTr in the folate-free (black ribbons) and folate-bound (green ribbons) states and a structure of a homologous CFeSP from Carboxydothermus hydrogenoformans (ChCFeSP) (pink). When aligned by the small subunit (light blue in Figure 1B but not shown here for clarity), these structures differ most in the positions of the mobile B12 (magenta sticks) and Fe4S4 (orange spheres) domains due to their inherent mobility.
Figure 4
Figure 4
SAXS-derived ab initio shape reconstructions depicting solution conformations of MeTr and CFeSP, free and in complex under assay conditions. (A) The molecular envelope reconstructed from 100 μM MeTr aligns well with the crystal structure of the homodimer, shown as pink and orange ribbons. (B) Likewise, the molecular envelope of 100 μM CFeSP aligns well with a CFeSP structure extracted from a crystal structure of the CFeSP/MeTr complex, shown as blue and green ribbons for the small and large subunits, respectively. The Fe4S4 cluster is shown as orange spheres and B12 in magenta sticks. (C) The molecular envelope reconstructed from a 150 μM equimolar solution of the CFeSP heterodimer, and the MeTr homodimer aligns well with the core domains of the 1:1 complex (ribbons, same coloring as in (A,B)). Shape reconstructions statistics are provided in Table 1.
Figure 5
Figure 5
Correlation of relative MeTr and CFeSP concentrations obtained by SAXS with those obtained spectroscopically. The molecular-weight-normalized forward scattering intensities from SAXS, I(0)/MW, linearly correlate with the spectroscopically determined molar concentration, c, indicating that oligomerization states do not change with increasing protein concentrations. Points for MeTr and CFeSP are nearly colinear, indicating that their SAXS-derived and spectroscopically determined relative concentrations are in agreement.
Figure 6
Figure 6
Global χ2 minimization of multispecies fitting to scattering data obtained in the titration of CFeSP (0–150 μM) into MeTr homodimer (fixed at 50 μM) under assay conditions. (A) Fits shown include: free MeTr + free CFeSP (black circles), free MeTr + free CFeSP + 2:1 complex (white circles), free MeTr + 1:1 complex (red diamonds), free MeTr + 1:1 complex + 2:1 complex (orange circles), free MeTr + free CFeSP + 1:1 complex (green diamonds), and free MeTr + free CFeSP + 1:1 complex + 2:1 complex (blue circles). (B) Close up of colored curves in (A).
Figure 7
Figure 7
Determination of subunit stoichiometry in the complex formation of MeTr and CFeSP. (A) Scattering profiles for the titration of 0–150 μM CFeSP into MeTr homodimer (50 μM) under assay conditions. Profile colors range from red to violet (bottom to top) and indicate increasing CFeSP concentrations. Linear combinations of free MeTr, free CFeSP, and the 1:1 complex fitted to the data (shown in black) and corresponding √χ2 values were obtained with the program OLIGOMER. (B) Scattering profiles for the titration described in (A) but under crystallization conditions fitted with linear combinations of free MeTr, free CFeSP, the 1:1 complex, and the 2:1 complex (black). (C) Plot of deconvolution results for CFeSP titration performed under assay conditions. Blue circles represent free MeTr homodimer, green circles represent free CFeSP heterodimer, and red circles represent the 1:1 complex (Figure 1D). Dashed vertical lines are visual guides for 50 and 100 μM CFeSP concentrations. (D) Plot of deconvolution results for CFeSP titration under crystallization conditions, with symbols and lines as described in (C). Black circles represent the 2:1 complex. The volume fractions are apparent values (see text).
Figure 8
Figure 8
Rg concentration dependence in presence of 25–150 μM equimolar mixtures of the CFeSP heterodimer with the MeTr homodimer. Under assay conditions (red circles), the Rg values show a slight linear decrease with increasing concentration, indicating that neither dissociation nor higher order oligomerization occurs over this concentration range. Linear extrapolation to zero concentration to eliminate volume exclusion effects gives Rg of 35.5 ± 0.5 Å, which agrees well with the theoretical value of 34.5 Å for the 1:1 complex (Figure 1D). Increasing the ionic strength to a total NaCl concentration of 200 mM (black diamonds) leads to partial dissociation below protein concentrations of 50 μM. Above 50 μM, the Rg values follow the same trend as that seen under assay conditions, suggesting that the 1:1 CFeSP/MeTr complex is favored even at increased ionic strength.
Figure 9
Figure 9
ITC analysis of subunit binding cooperativity under assay conditions. (A) Raw measured heat changes as a function of time injecting 800 μM MeTr into 83 μM CFeSP and (B) corresponding normalized measured heats of injection. (C) Raw measured heat changes as a function of time injecting 153 μM CFeSP into 10.95 μM MeTr and (D) corresponding normalized measured heats of injection. A global analysis of the data assuming noncooperative binding of CFeSP to MeTr yields a poor fit (red lines in B and D, χ2 = 8.60). Allowing for cooperativity in the global model leads to a significantly improved fit (black lines in B and D, χ2 = 1.65), yielding an enthalpy change of ΔH of 4.9 [4.1–6.1] kcal/mol for the 1:1 complex and Kds of 7.7 [4.4–12.8] and 111 [90–143] μM for the first and second binding events, respectively. Uncertainties are asymmetric 95% confidence intervals.
Figure 10
Figure 10
Pair-distance distribution, P(r), plots of species in CFeSP/MeTr mixtures. (A) Under assay conditions, the maximum particle dimensions, Dmax, for the free subunits are <100 Å and consistent with the crystal structures of the individual proteins.,Dmax values for CFeSP/MeTr mixtures also do not exceed 100 Å under assay conditions (blue curves), while Dmax extends to ∼140 Å under crystallization conditions (red curve). This result is consistent with the 1:1 CFeSP/MeTr complex being the largest species under assay conditions, even in the presence of excess CFeSP (blue dashed curve), and the appearance of the 2:1 CFeSP/MeTr complex under crystallization conditions. (B) Titration of PEG MME 5000 into a solution with 100 μM CFeSP and 50 μM MeTr leads to an increase in Dmax from ∼100 Å toward ∼140 Å. At the maximum PEG concentration tested, 12%, even higher order oligomerization is detected (Dmax > 150 Å). For comparison, the PEG MME 5000 concentration is 3% in the crystallization condition.
Figure 11
Figure 11
Interaction interfaces between CFeSP and MeTr observed in crystal structures of the complex. (A) The small subunit and the Fe4S4 domain of each CFeSP (cyan) interact with MeTr (pink) at two distinct locations. CFeSP binds specifically to sites on opposing sides of the MeTr homodimer (red ☆) and makes nonspecific interactions with closely spaced hydrophobic regions on the TIM barrel walls (blue ○). (B) Close-up view of the specific CFeSP binding site on MeTr (☆ in (A)), consisting of hydrogen bonds and a salt bridge between Glu203 of the CFeSP small subunit and Lys257 of MeTr. (C) Nonspecific CFeSP–MeTr interactions are made by hydrophobic residues on the CFeSP Fe4S4 domains and the MeTr TIM barrel walls (○ in (A)).

References

    1. Ragsdale S. W. Ann. N.Y. Acad. Sci. 2008, 1125, 129. - PMC - PubMed
    1. Ragsdale S. W.; Pierce E. Biochim. Biophys. Acta 2008, 1784, 1873. - PMC - PubMed
    1. Drake H. L.; Gössner A. S.; Daniel S. L. Ann. N.Y. Acad. Sci. 2008, 1125, 100. - PubMed
    1. Phillips J. R.; Clausen E. C.; Gaddy J. L. Appl. Biochem. Biotechnol. 1994, 45, 145.
    1. Slivka R. M.; Chinn M. S.; Grunden A. M. Biofuels 2011, 2, 405.

Publication types

LinkOut - more resources