. 2012 Dec;23(23):4623-34.
doi: 10.1091/mbc.E12-02-0133. Epub 2012 Oct 10.

Gαs promotes EEA1 endosome maturation and shuts down proliferative signaling through interaction with GIV (Girdin)

Affiliations

Gαs promotes EEA1 endosome maturation and shuts down proliferative signaling through interaction with GIV (Girdin)

Anthony O Beas et al. Mol Biol Cell. 2012 Dec.

Abstract

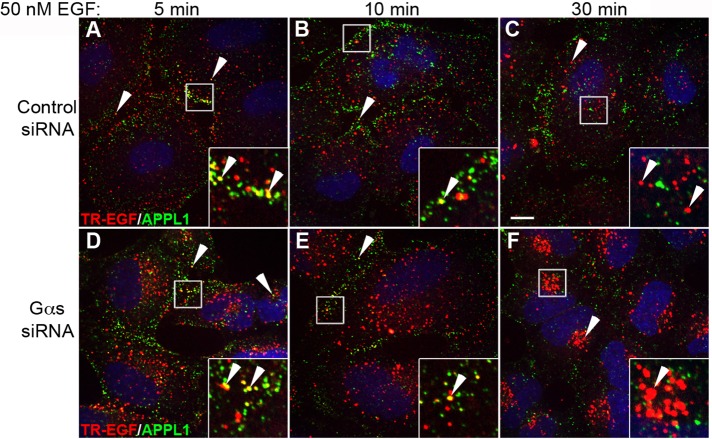
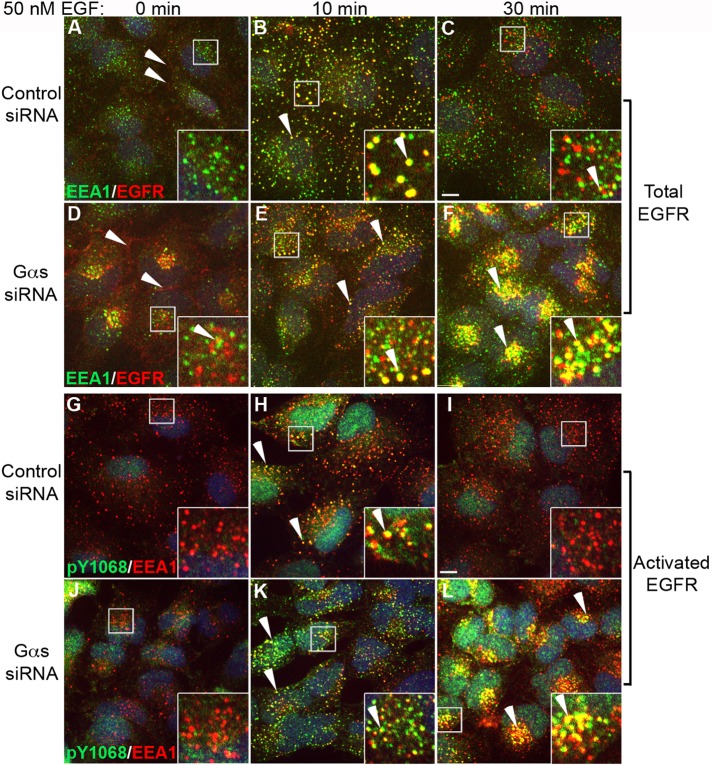
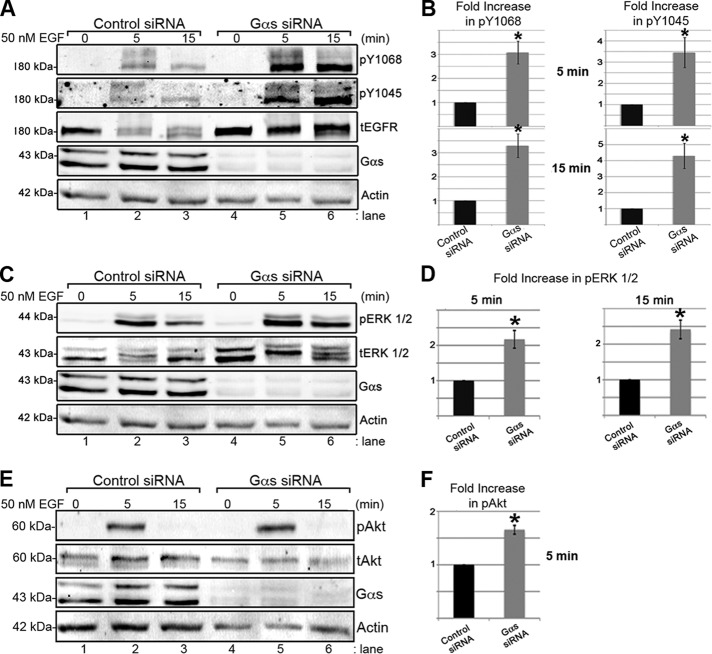
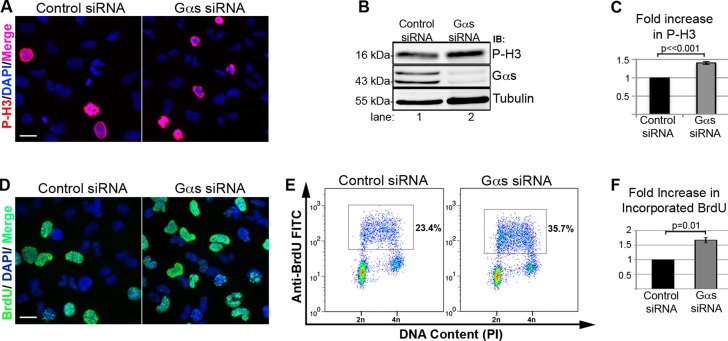
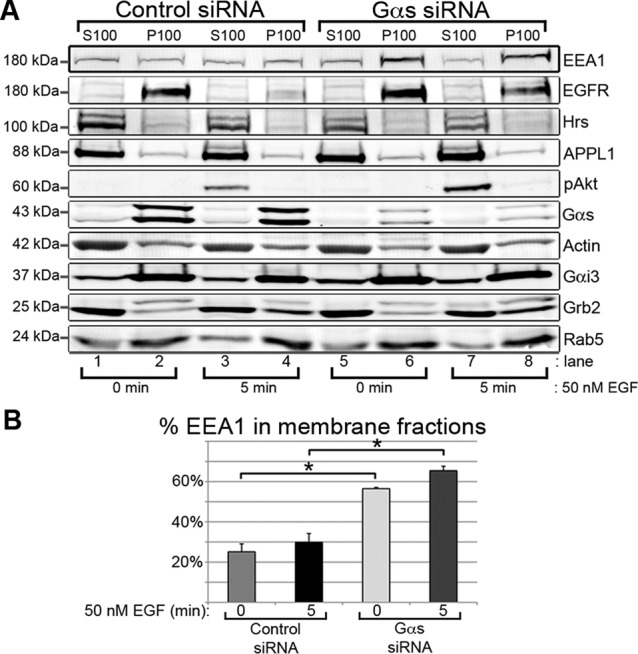
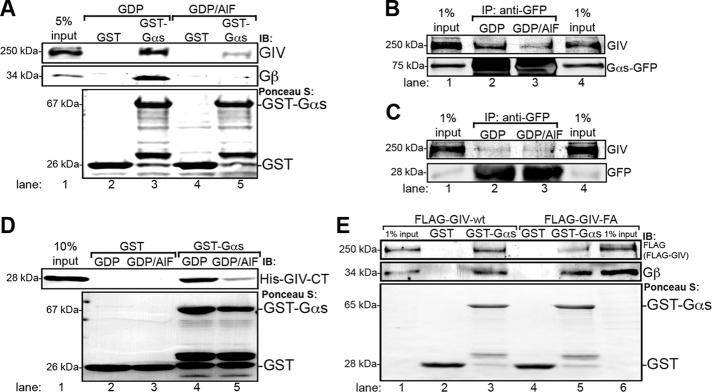
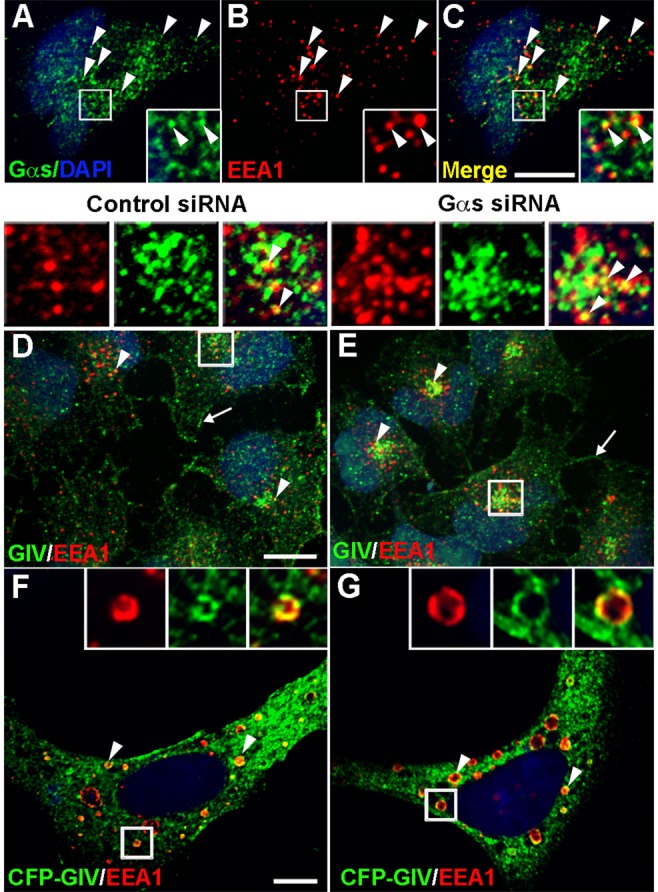
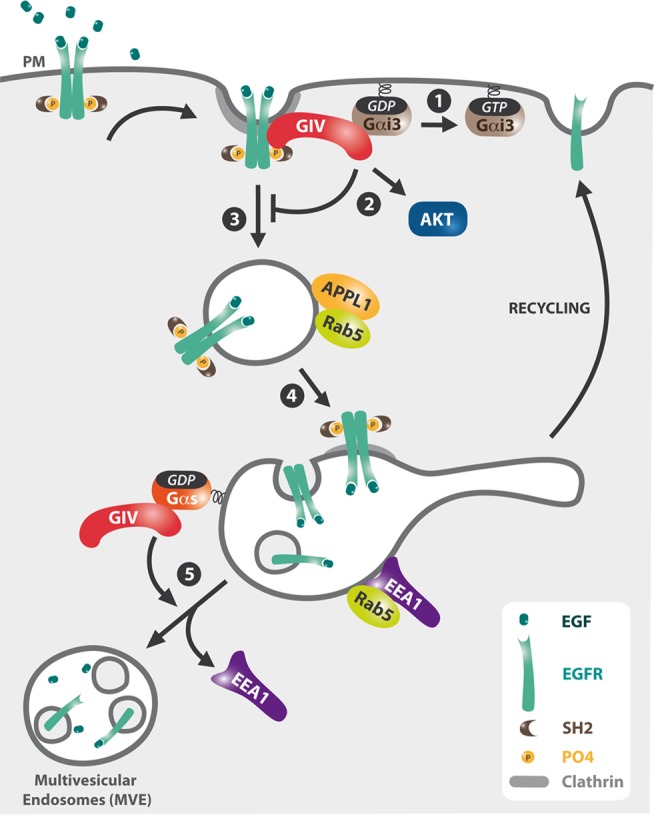
The organization of the endocytic system into biochemically distinct subcompartments allows for spatial and temporal control of the strength and duration of signaling. Recent work has established that Akt cell survival signaling via the epidermal growth factor receptor (EGFR) occurs from APPL early endosomes that mature into early EEA1 endosomes. Less is known about receptor signaling from EEA1 endosomes. We show here that EGF-induced, proliferative signaling occurs from EEA1 endosomes and is regulated by the heterotrimeric G protein Gαs through interaction with the signal transducing protein GIV (also known as Girdin). When Gαs or GIV is depleted, activated EGFR and its adaptors accumulate in EEA1 endosomes, and EGFR signaling is prolonged, EGFR down-regulation is delayed, and cell proliferation is greatly enhanced. Our findings define EEA1 endosomes as major sites for proliferative signaling and establish that Gαs and GIV regulate EEA1 but not APPL endosome maturation and determine the duration and strength of proliferative signaling from this compartment.


Figures

FIGURE 1:
FIGURE 1:
Trafficking of TR-EGF through APPL1 endosomes. HeLa cells were transfected with control (A–C) or Gαs (D–F) siRNA, serum starved (0.2% FBS) overnight, and stimulated with 300 ng/ml TR-EGF for 5, 10, or 30 min. Cells were fixed (3% paraformaldehyde), stained for APPL1 (green), and examined by confocal microscopy. At 5 min TR-EGF localizes to punctate, peripheral APPL1 endosomes (yellow, arrowheads) in both control (A) and Gαs-depleted (D) cells (13 ± 4% vs. 17 ± 3%). At 10 min (B, E) some TR-EGF (13 ± 3% vs. 12 ± 3%) remains localized to APPL1 endosomes (yellow, arrowheads), and by 30 min little TR-EGF (red, arrowheads) is detected in APPL endosomes (green) in either Gαs-depleted cells (F) or controls (C; 10 ± 3% vs. 6 ± 1%). At 30 min TR-EGF (red, arrowheads) is located in small endosomes distributed throughout the cytoplasm and is not found in APPL endosomes in controls (C), whereas in Gαs-depleted cells (F) it accumulates in tightly clustered, juxtanuclear endosomes. Bar, 10 μm. Insets, 3× enlargement of boxed regions.
FIGURE 2:
FIGURE 2:
Gαs depletion prolongs and enhances EGFR signaling from EEA1 endosomes. (A–F) Gαs-depleted and control HeLa cells were serum starved, stimulated with 50 nM EGF for 0, 10, or 30 min, stained for total EGFR (red) and EEA1 (green), and analyzed as in Figure 1. In controls (A) before EGF stimulation (0 min) EGFR is found at the PM (red, arrowheads) and occasionally in intracellular vesicles that mostly do not colocalize with EEA1 (green, inset). At 10 min after stimulation (B) EGFR localizes to EEA1 early endosomes (yellow, arrowheads), and by 30 min (C) relatively few EGFR remain in EEA1 endosomes. In Gαs-depleted cells, before EGF stimulation (D) EGFRs are also concentrated near the PM (red, arrowhead) and in intracellular vesicles, which sometimes colocalize with EEA1 (yellow, inset). At 10 min after stimulation (E), colocalization with EEA1 in early endosomes is increased; by 30 min (F) there is a striking accumulation of EGFR in juxtanuclear clusters of EEA1 endosomes in Gαs-depleted cells (yellow, F), whereas little EGFR remains in controls (C). (G–L) Gαs-depleted HeLa cells and controls were treated as in A–F and stained for activated (phosphorylated) pY1068-EGFR (green) and EEA1 (red). After serum starvation (0 min), little pY1068 staining for activated receptors is observed at the PM or at EEA1 endosomes in either control (G) or Gαs-depleted (J) cells. At 10 min after stimulation activated EGFRs are associated with EEA1 endosomes in both control (H) and Gαs-depleted (K) cells (yellow, arrowheads). By 30 min, activated EGFRs are barely detectable in EEA1 endosomes (red) in controls (I), whereas there is a striking accumulation of activated EGFR in juxtanuclear clusters of EEA1 endosomes (yellow, arrowheads) in Gαs depleted cells (L). Bar, 10 μm. Insets, 3× enlargement of boxed regions.
FIGURE 3:
FIGURE 3:
Gαs depletion increases and prolongs EGF-induced EGFR activation and phosphorylation of ERK1/2 but not Akt. (A, B) The amount of activated EGFR (pY1068 and pY1045) seen after EGF stimulation at 5 (lane 5) and 15 (lane 6) min is much greater in Gαs-depleted cells than in controls (lanes 2 and 3). (B) Quantification reveals that pY1068 (n = 3, *p < 0.005) and pY1045 (n = 5, *p < 0.02) are increased greater than threefold in Gαs-depleted cells at 5 and 15 min after EGF stimulation. Cell lysates from control (lanes 1–3) or Gαs-depleted (lanes 4–6) HeLa cells treated as in Figure 2, A–F, were stimulated with 50 nM EGF for 5 or 15 min, immunoblotted for total EGFR (tEGFR), activated EGFR (pY1068- and pY1045), Gαs, and actin, and quantified using Odyssey imaging software, version 2.1. Bands were normalized to actin at each time point, averaged, and plotted as the fold increase in phosphorylation vs. control ± SEM. (C, D) Gαs-depleted cells show greater than twofold more pERK1/2 at 5 (lane 5) and 15 min (lane 6) after stimulation than controls (lanes 2 and 3; n = 4, *p < 0.05). (E and F) Gαs-depleted cells show 1.6-fold more pAkt than controls (lanes 2 and 3) at 5 min (lane 5) but not at 15 min (lane 6) after stimulation (n = 4, *p < 0.001). Control (lanes 1–3) or Gαs-depleted (lanes 4–6) HeLa cells treated as in A were immunoblotted for pERK1/2, tERK1/2, pAkt, tAkt, Gαs, and actin and quantified as in B.
FIGURE 4:
FIGURE 4:
Gαs depletion leads to increased cell proliferation. (A) The number of nuclei that stain for P-H3 (red) is increased after Gαs depletion (right) compared with controls (left). (B, C) Gαs-depleted cells (lane 2) show 1.47-fold more P-H3 than controls (lane 1) by immunoblotting. In A, control or Gαs siRNA–treated HeLa cells were fixed and stained for P-H3 (red) and DAPI (blue). Bar, 10 μm. In B, whole-cell lysates prepared from control or Gαs siRNA–treated HeLa cells were immunoblotted for P-H3, tubulin, and Gαs. In C, P-H3 bands such as those in B were quantified from four different experiments, normalized to tubulin, averaged, and plotted ± SEM (p < 0.001). (D) The number of cells that stain for incorporated BrdU (green) is increased after Gαs depletion (right) compared with controls (left). Bar, 10 μm. (E, F) A representative two-dimensional flow cytometry experiment indicating a 1.75-fold increase (35.7 vs. 20.4%) in proliferating cells after Gαs depletion. In D and E, HeLa cells were pulse labeled with BrDU for 30 min and either processed for immunofluorescence (D) or flow cytometry (E) as described in Material and Methods. In F, four experiments such as that shown in E were quantified, normalized, and graphed (± SEM; n = 4, p = 0.01).
FIGURE 5:
FIGURE 5:
Gαs regulates the membrane association of EEA1. (A) In Gαs-depleted cells there is significantly more EEA1 in membrane fractions at 0 (lane 6) and 5 min (lane 8) after EGF stimulation than in controls (lanes 2 and 4). However, there is no change in the membrane association of Rab5, APPL1, Hrs, Gαi3, Grb2, or pAkt. HeLa cells transfected with control siRNA (lanes 1–4) or Gαs siRNA (lanes 5–8) were starved (lanes 1, 2, 5, and 6) or stimulated for 5 min with 50 nM EGF (lanes 3,4, 7, and 8) as in Figure 3A. (B) Quantification of the data such as those in A reveals that in controls (control siRNA) 25 and 30% of the EEA1 was in membrane fractions at 0 and 5 min after stimulation, respectively, whereas after Gαs depletion (Gαs siRNA) 57 and 65% of the EEA1 is on membranes at the same time points. Membrane (120,000 × g pellet, P100) and cytosolic (120,000 × g supernatant, S100) fractions were prepared and immunoblotted as indicated. The percentage of EEA1 in P100 fractions was calculated from (P100/2)/(S100 + P100/2) × 100 and plotted ± SEM (n = 3, *p << 0.01).
FIGURE 6:
FIGURE 6:
Inactive Gαs (Gαs-GA) reverses the effects of Gαs depletion on EGFR autophosphorylation and the membrane association of EEA1. (A, B) Transfection of Gαs-depleted cells with an inactive srGαs-GA mutant (lanes 10–12) but not an active srGαs-QL mutant (lanes 7–9) reverses the effects of Gαs depletion (lanes 4–6) and restores EGFR autophosphorylation to levels comparable to controls (lanes 1–3). Control (lanes 1–3) or Gαs siRNA–treated (lanes 4–12) HeLa cells were transfected with pCDNA3.1 (vector; lanes 1–6), constitutively active srGαs-QL (lanes 7–9), or inactive srGαs-GA (lanes 10–12) and then serum starved, stimulated with EGF, and immunoblotted as in Figure 3A. pY1068 and pY1045 bands such as those in A were quantified from four different experiments, averaged, normalized, and plotted as in Figure 3B (*p < 0.05). Black bar, control siRNA + vector; dark gray bar, Gαs siRNA + vector; light gray bar, Gαs siRNA + srGαs-Q227L; open bar, Gαs siRNA + srGαs-G226A. (C, D) An inactive Gαs mutant reverses the effect of Gαs depletion on the membrane distribution of EEA1. In Gαs-depleted cells transfected with srGαs-GA (lanes 5 and 6) and in controls transfected with vector alone (lanes 1 and 2), ∼16% of the total EEA1 is associated with the membrane fraction, whereas in Gαs-depleted cells (lanes 3 and 4), ∼29% of EEA1 is in the membrane fraction. Membrane and cytosol fractions were prepared from control siRNA–treated HeLa cells transfected with vector (lanes 1 and 2), Gαs siRNA–treated cells transfected with vector (lanes 3 and 4), or inactive srGαs-GA (lanes 5 and 6) and immunoblotted for EEA1, actin, and Gαs as in Figure 5A. (D) The percentage of EEA1 on membranes was calculated and plotted as in Figure 5B (n = 7, *p < 0.05). Light gray bar, control siRNA + vector; black bar, Gαs siRNA + vector; dark gray bar, Gαs siRNA + srGαs-GA.
FIGURE 7:
FIGURE 7:
Inactive Gαs directly binds GIV. (A) Endogenous GIV and Gβ (used as a positive control) preferentially bind inactive GST-Gαs-GDP (lane 3, upper panels). Little binding to active GST-Gαs-GDP/AlF3 (lane 5) or GST alone (lanes 2 and 4) is observed. Purified GST-Gαs (lanes 3 and 5) and GST alone (lanes 2 and 4) were preloaded with GDP (lanes 2 and 3) or GDP/AlF3 (lanes 4 and 5) and incubated overnight with ∼1 mg Cos7 cell lysate. Lane 1, 5% input. Recombinant proteins were visualized by Ponceau S staining (lower panel), and bound proteins were analyzed by immunoblotting for GIV and Gβ (top). (B, C) Endogenous GIV coimmunoprecipitates with Gαs-GFP-GDP (B, lane 2) but not Gαs-GFP-GDP/AlF3 (B, lane 3) or GFP alone (C; lanes 2 and 3), indicating that GIV preferentially interacts with GDP-bound Gαs. Cos7 cells expressing Gαs-GFP (B) or GFP alone (C) were lysed in the presence of GDP (lanes 1 and 2) or GDP/AlF3, (lanes 3 and 4) and incubated with anti-GFP IgG, and bound proteins were analyzed by immunoblotting for GFP and endogenous GIV. Lanes 1 and 4, 1% input. (D) GST-Gαs-GDP (lane 4) but not GST-Gαs-GDP/AlF3 (lane 5) or GST alone (lanes 2 and 3) binds His-GIV-CT (amino acids 1623–1870), indicating that GIV-CT binds directly to inactive Gαs. Purified GST (lanes 2 and 3) or GST-Gαs (lane 4 and 5) was preloaded with GDP (lanes 2 and 4) or GDP/AlF3 (lanes 3 and 5) as in A and incubated with purified His-GIV-CT. Lane 1, 10% input. (E) GST-Gαs-GDP binds FLAG-GIV-wt (lane 3), but binding of the mutant FLAG-GIV-FA (lane 5) is greatly decreased, indicating that the GEF motif in the C-terminus of GIV binds inactive Gαs. Purified GST (lanes 2 and 4) or GST-Gαs (lanes 3 and 5) was preloaded with GDP and incubated with lysates from Cos7 cells expressing either FLAG-GIV-wt (lanes 1–3) or FLAG-GIV-FA (lanes 4–6). Lanes 1 and 6, 1% input. Recombinant proteins were visualized by Ponceau S staining (bottom), and bound proteins were analyzed by immunoblotting (top) for FLAG (FLAG-GIV) and Gβ.
FIGURE 8:
FIGURE 8:
Gαs and GIV localize to EEA1 early endosomes. (A–C) Gαs is associated with EEA1 early endosomes in HeLa cells (C, arrowheads). HeLa cells were serum starved and stained for endogenous Gαs (green) and EEA1 (red) and processed and analyzed as in Figure 1. (D, E) In both control (control siRNA) and Gαs-depleted (Gαs siRNA) cells, GIV (green) is found along the PM (arrows) and associated with EEA1 early endosomes (arrowheads, yellow). Control and Gαs-depleted HeLa cells were serum starved, stained for endogenous GIV and EEA1, and processed and analyzed as in Figure 1. (F, G) CFP-GIV colocalizes with EEA1 on Rab5QL enlarged early endosomes (yellow, arrowheads) in both control (F) and Gαs-depleted cells (G). CFP-GIV and Rab5-QL were coexpressed in control or Gαs-depleted HeLa cells, stained for GIV (green) and EEA1 (red), and analyzed by confocal microscopy as in Figure 1. Bar, 10 μm. Insets, 3× enlargement of boxed regions.
FIGURE 9:
FIGURE 9:
GIV depletion increases the membrane association of EEA1 and prolongs and enhances EGFR signaling from EEA1 endosomes. (A–F) Before EGF stimulation (0 min), little pY1068 staining for activated receptors (green) is observed at the PM or EEA1 endosomes (red) in either control (A) or GIV-depleted (D) cells. At 10 min after stimulation some activated EGFRs are associated with EEA1 endosomes in both control (B) and GIV-depleted (E) cells (yellow, arrowheads). By 30 min, activated EGFRs are barely detectable in EEA1 endosomes in controls (C), whereas GIV-depleted cells show a striking accumulation of activated EGFRs in EEA1 endosomes (F; yellow, arrowheads). GIV-depleted HeLa cells and controls were serum starved, stimulated with EGF, and stained for pY1068-EGFR (green) and EEA1 (red). Bar, 10 μm. (G, H) After GIV depletion, 24% of the total EEA1 is associated with membrane fractions, ∼11% in controls. The distribution of EEA1, GIV, Gαs, and actin in membrane (120,000 × g pellet, P100) and cytosolic (120,000 × g supernatant, S100) fractions prepared from control (lanes 1 and 2) or GIV-depleted (lanes 3 and 4) HeLa cells was assessed by immunoblotting. EEA1 bands such as those in A were quantified from three different experiments and averaged, and the percentage of EEA1 on membrane fractions calculated and plotted as in Figure 5B (*p < 0.01). (I, J) Gαs and GIV cooperatively facilitate the loss of EEA1 from membranes. The amount of EEA1 on membranes after depletion of both Gαs and GIV (lanes 5 and 6) is similar to that seen after depletion of Gαs alone (lanes 7 and 8). HeLa cells were depleted of GIV, Gαs, or both GIV and Gαs and fractions prepared and immunoblotted as in A. Results are shown as the mean ± SEM (p = 0.02; n/s, no significant difference).
FIGURE 10:
FIGURE 10:
Working model. GIV spatially regulates the trafficking and signaling of EGFR via sequential interactions with Gαi3 and Gαs. Upon EGF stimulation, GIV binds EGFR and assembles an EGFR/GIV/Gαi3 complex at the PM that activates Gαi3 (1), prolongs the association of EGFR with the PM, and enhances PM-based Akt signaling (2). On internalization EGFR traffics to APPL endosomes (3) and then to EEA1 endosomes (4), where GIV binds inactive Gαs, and promotes dissociation of EEA1 and endosome maturation to MVEs (5), which facilitates EGFR down-regulation and shuts off proliferative signaling from endosomes.

References

    1. Babst M. MVB vesicle formation: ESCRT-dependent, ESCRT-independent and everything in between. Curr Opin Cell Biol. 2011;23:452–457. - PMC - PubMed
    1. Barbieri MA, Li G, Colombo MI, Stahl PD. Rab5, an early acting endosomal GTPase, supports in vitro endosome fusion without GTP hydrolysis. J Biol Chem. 1994;269:18720–18722. - PubMed
    1. Di Guglielmo GM, Baass PC, Ou WJ, Posner BI, Bergeron JJ. Compartmentalization of SHC, GRB2 and mSOS, and hyperphosphorylation of Raf-1 by EGF but not insulin in liver parenchyma. EMBO J. 1994;13:4269–4277. - PMC - PubMed
    1. Felberbaum-Corti M, Cavalli V, Gruenberg J. Capture of the small GTPase Rab5 by GDI: regulation by p38 MAP kinase. Methods Enzymol. 2005;403:367–381. - PubMed
    1. Garcia-Marcos M, Ghosh P, Farquhar MG. GIV is a nonreceptor GEF for G alpha i with a unique motif that regulates Akt signaling. Proc Natl Acad Sci USA. 2009;106:3178–3183. - PMC - PubMed

Publication types

MeSH terms