. 2013 Sep;218(5):1229-77.
doi: 10.1007/s00429-012-0456-8. Epub 2012 Sep 30.

Development of the serotonergic cells in murine raphe nuclei and their relations with rhombomeric domains

Affiliations

Development of the serotonergic cells in murine raphe nuclei and their relations with rhombomeric domains

Antonia Alonso et al. Brain Struct Funct. 2013 Sep.

Abstract

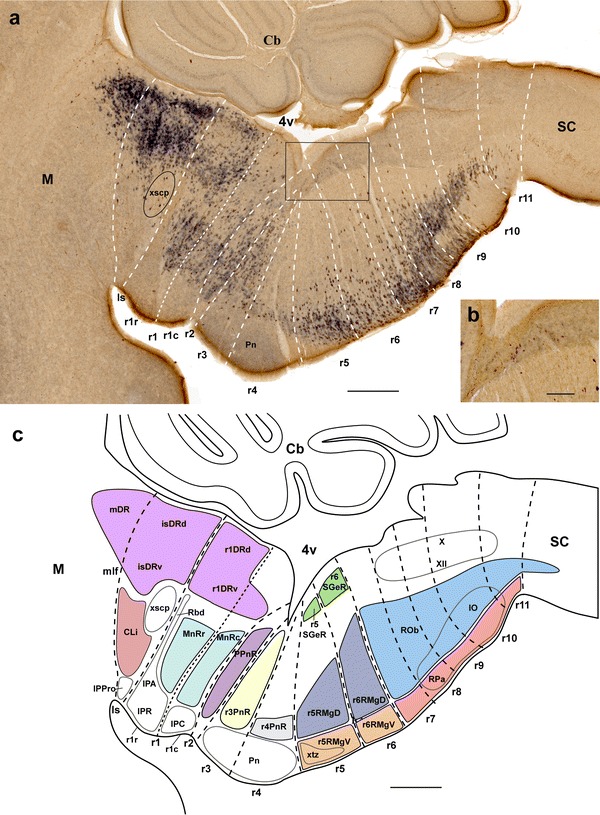
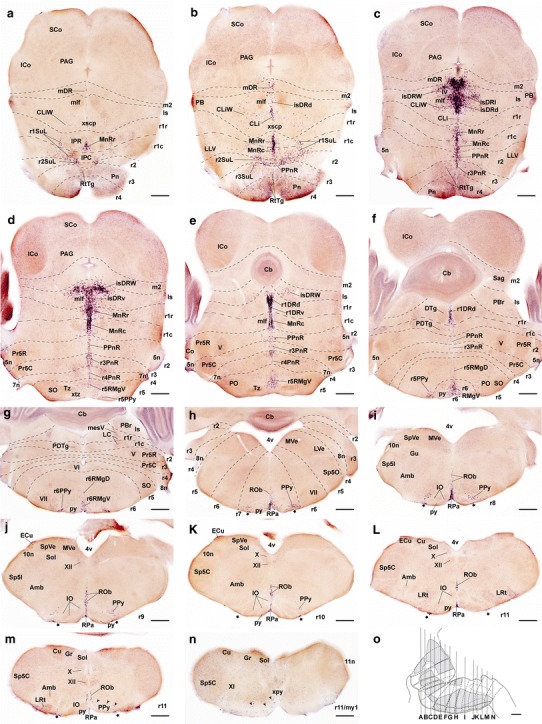
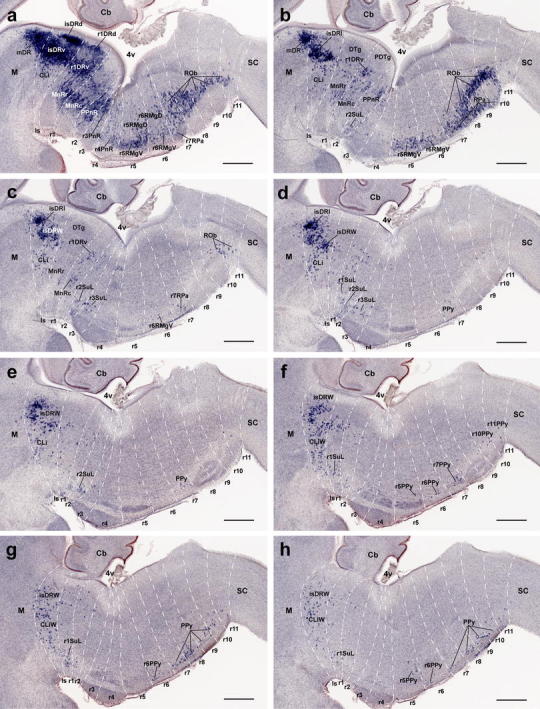
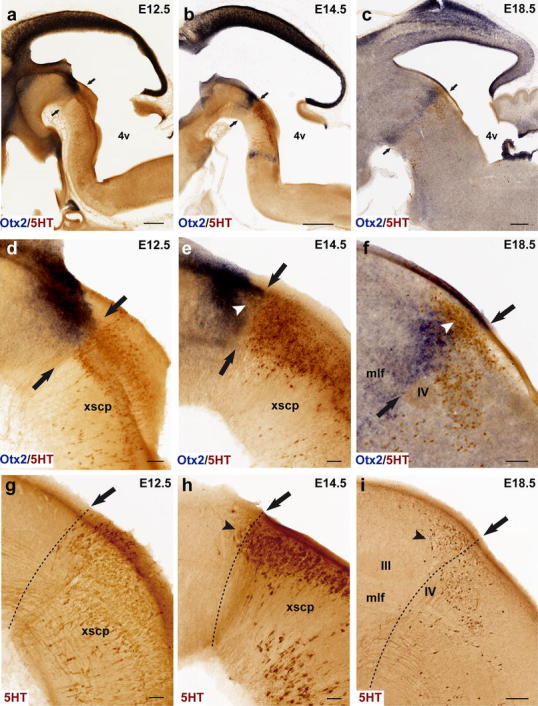
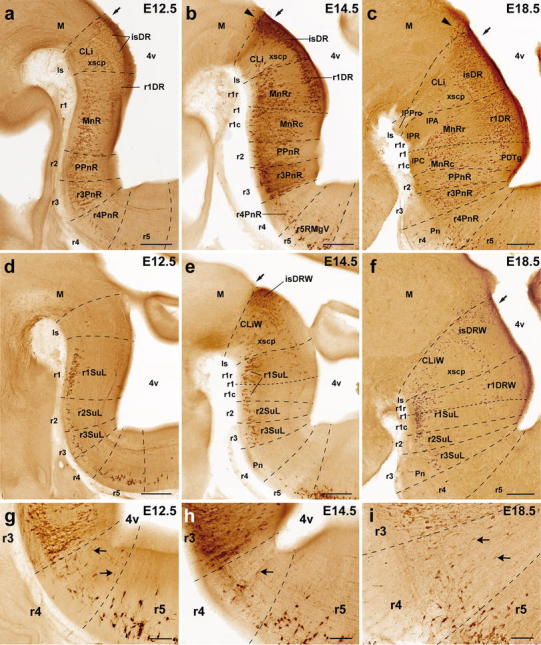
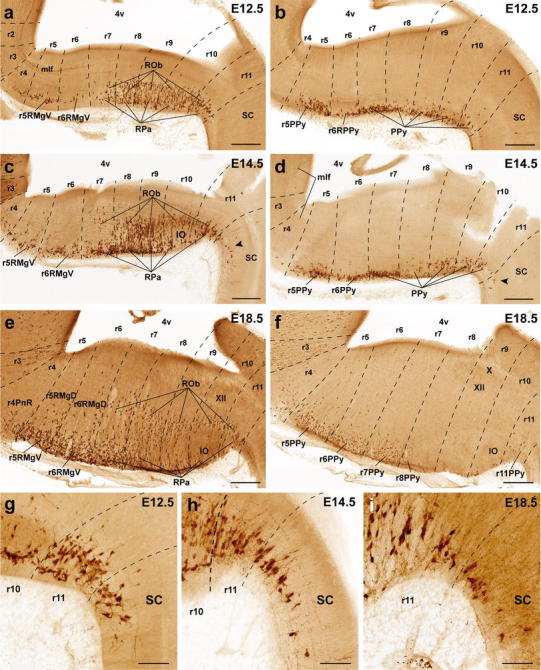
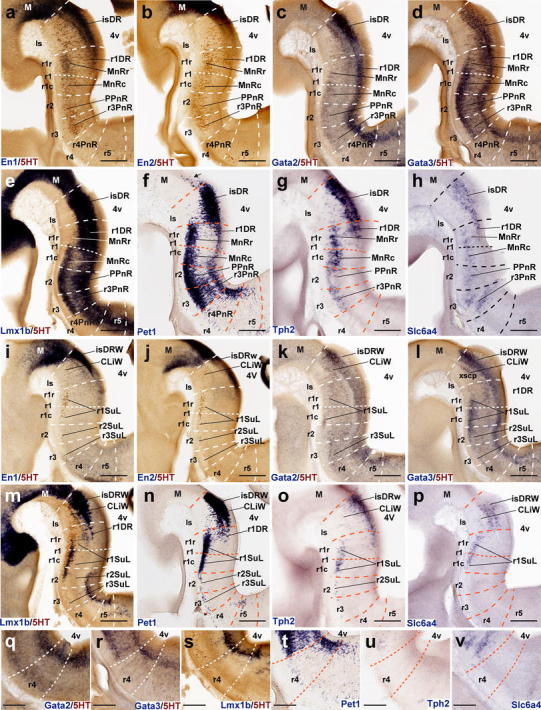
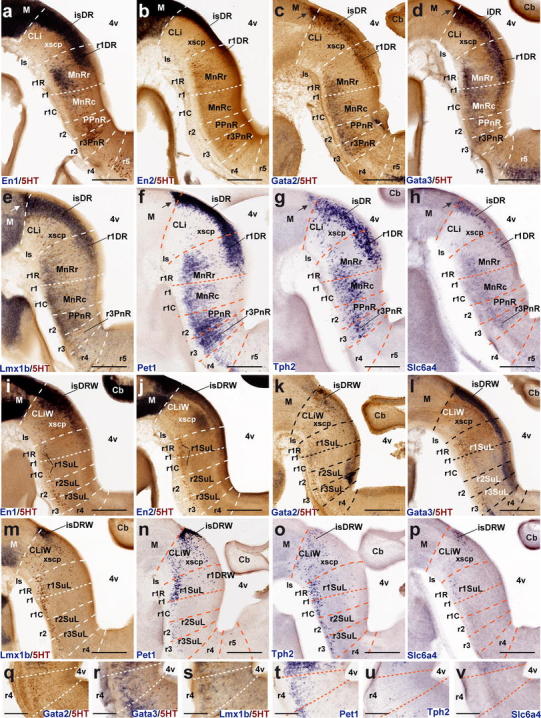
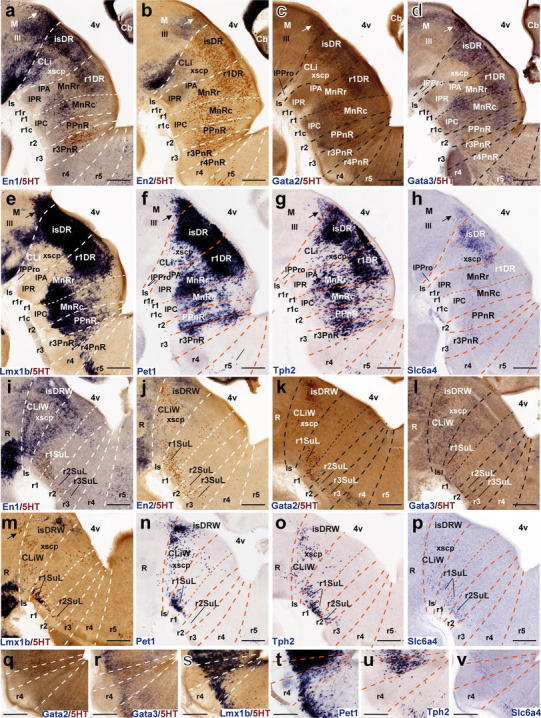
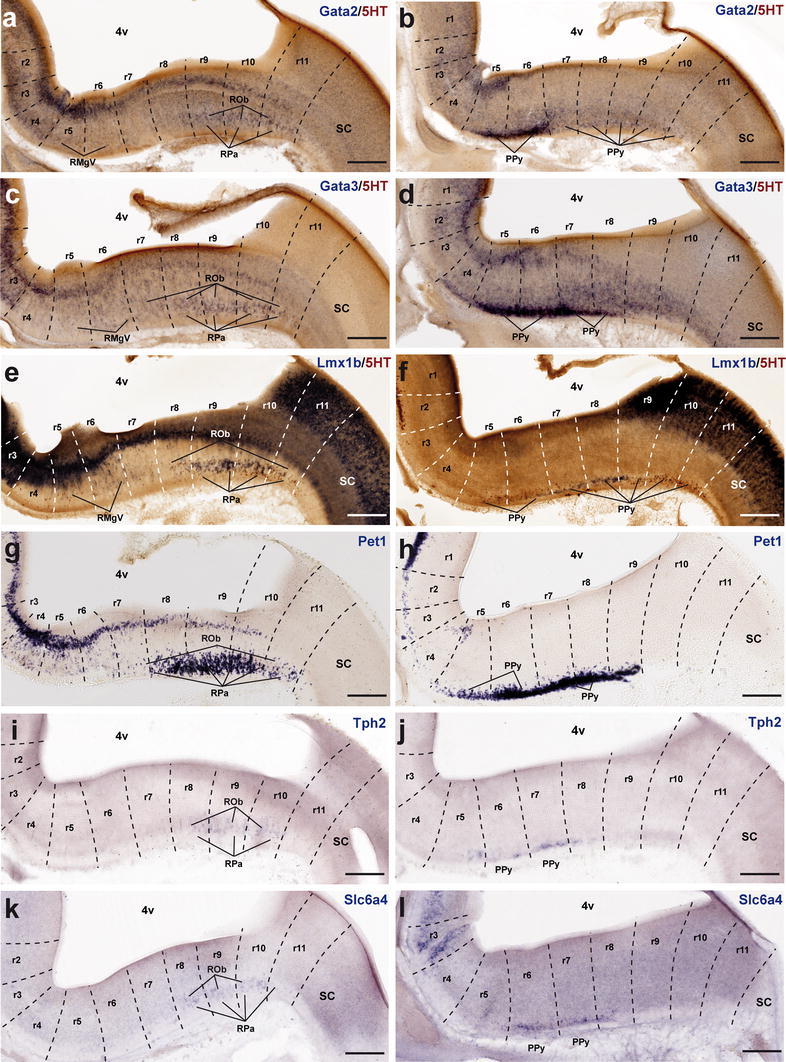
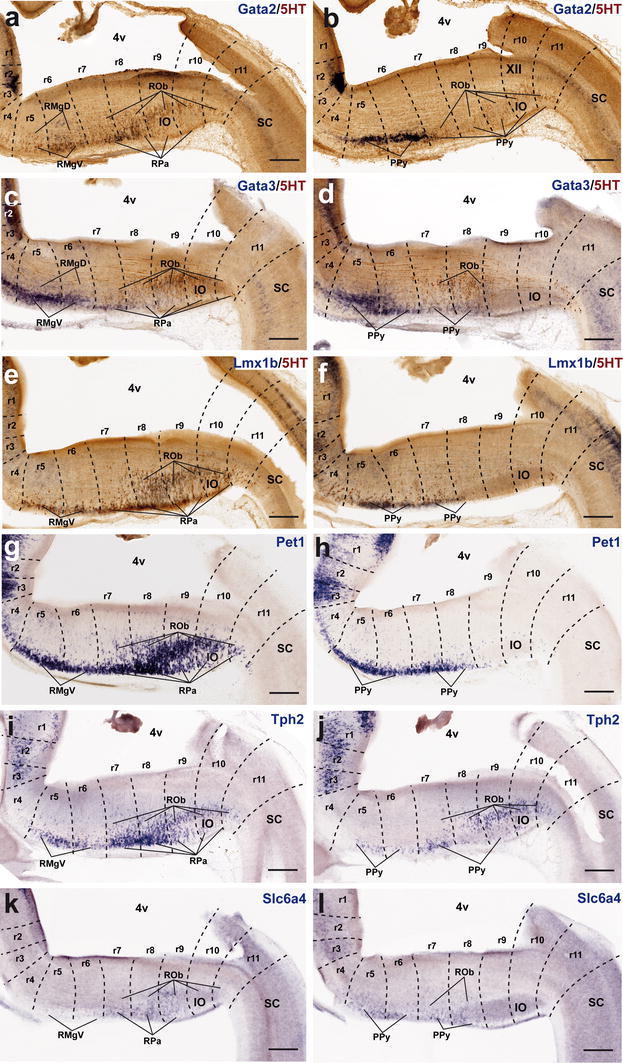
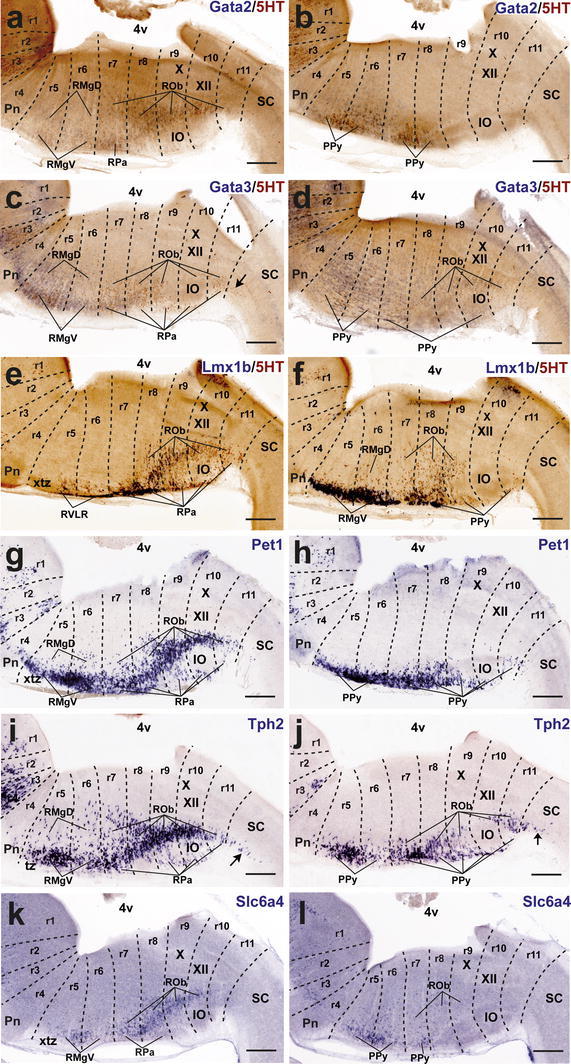
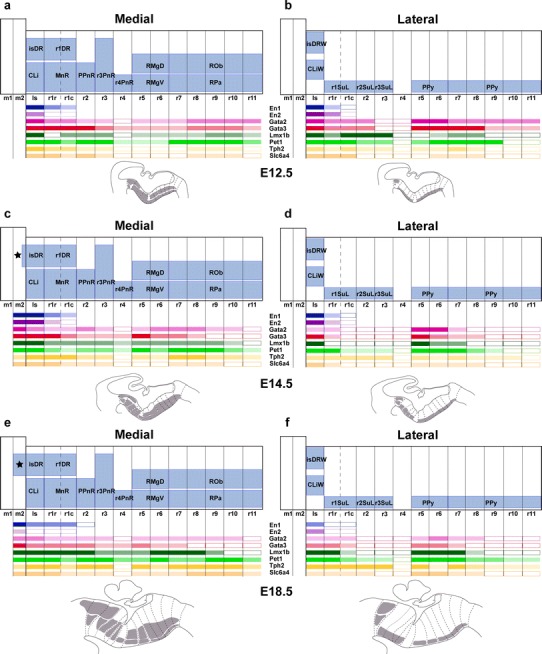
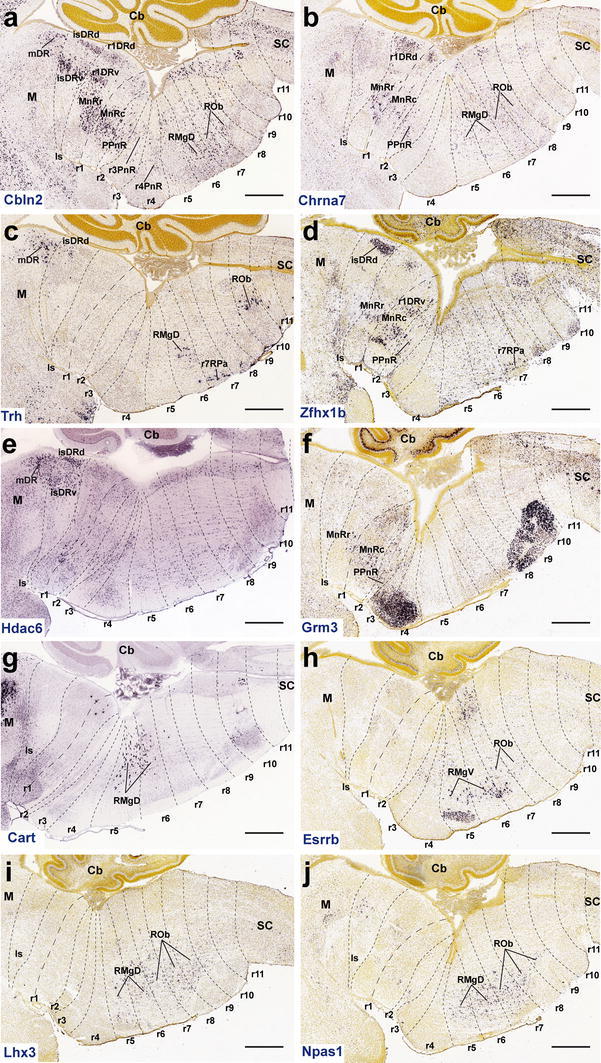
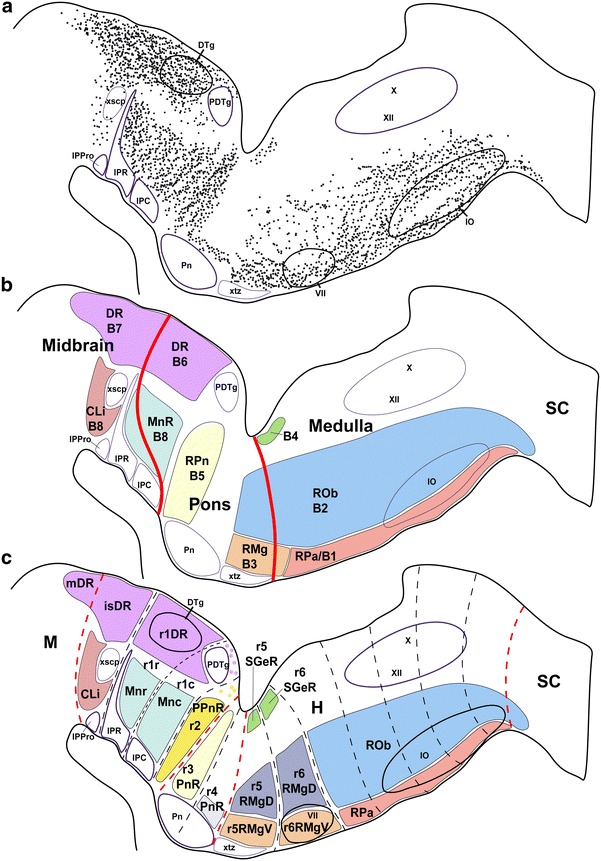
The raphe nuclei represent the origin of central serotonergic projections. The literature distinguishes seven nuclei grouped into rostral and caudal clusters relative to the pons. The boundaries of these nuclei have not been defined precisely enough, particularly with regard to developmental units, notably hindbrain rhombomeres. We hold that a developmental point of view considering rhombomeres may explain observed differences in connectivity and function. There are twelve rhombomeres characterized by particular genetic profiles, and each develops between one and four distinct serotonergic populations. We have studied the distribution of the conventional seven raphe nuclei among these twelve units. To this aim, we correlated 5-HT-immunoreacted neurons with rhombomeric boundary landmarks in sagittal mouse brain sections at different developmental stages. Furthermore, we performed a partial genoarchitectonic analysis of the developing raphe nuclei, mapping all known serotonergic differentiation markers, and compared these results, jointly with others found in the literature, with our map of serotonin-containing populations, in order to examine regional variations in correspondence. Examples of regionally selective gene patterns were identified. As a result, we produced a rhombomeric classification of some 45 serotonergic populations, and suggested a corresponding modified terminology. Only a minor rostral part of the dorsal raphe nucleus lies in the midbrain. Some serotonergic neurons were found in rhombomere 4, contrary to the conventional assumption that it lacks such neurons. We expect that our reclassification of raphe nuclei may be useful for causal analysis of their differential molecular specification, as well as for studies of differential connectivity and function.


Figures

Fig. 1
Fig. 1
Partial overview of mouse raphe nuclei in a paramedian sagittal section at P10. a The staining involves 5-HT-immunoreaction (brown) plus Pet1 in situ hybridization (blue). Interrhombomeric boundaries are drawn as white dashed lines (smaller dashes separate the rostral and caudal halves of r1). b Higher magnification of the periventricular area boxed in a, showing the 5-HT-positive cells of the supragenual raphe cells in r5–r6. c Schema according to a, interpreting the topological and topographic relations of the illustrated raphe nuclei within the rhombomeric map. A color-code was applied to facilitate group distinction. Some characteristic adjacent grisea are indicated as contours for topographic reference. Note that laterally placed raphe nuclei are not shown in this figure. For abbreviations see "List of abbreviations". Scale bar 500 μm in a and c, and 150 μm in b
Fig. 2
Fig. 2
Pet1 expression detected by in situ hybridization across the midbrain–hindbrain continuum, shown in a series of 14 non-consecutive standard ‘cross sections’ at P10 (these are first horizontal and then transversal to the rhombomeres; see schema of section levels and planes in o, based on Fig. 1c). The rhombomeric boundaries are traced as thin dashed lines. Selected other structures are identified for topographic reference. a–c Levels through rostral midbrain and ventral parts of prepontine/pontine hindbrain (sections are here distinctly horizontal). d–f Levels through caudal midbrain, dorsal parts of prepontine/pontine hindbrain and rostral cerebellum (sections are still largely horizontal). g–n Levels through retropontine and medullary hindbrain (transversal sections). o Schema representing the different levels of section shown in a–n. Black stars in h–m mark subpial pet1-positive cells found superficial to the pyramidal tract (py). Arrowheads in m and n point out pet1-positive cells associated to the pyramidal decussation (xpy). For abbreviations see "List of abbreviations". scale bar 350 μm in a–n, and 150 μm in o
Fig. 3
Fig. 3
Pet1 detected by in situ hybridization in a series of consecutive sagittal sections proceeding from medial to lateral at P0. The rhombomeric boundaries are traced as white dashed lines (smaller dashes separate the rostral and caudal halves of r1). a, b Paramedian levels; compare a with the P10 distribution shown in Fig. 1a. c–h More lateral levels, showing the migrated wing and ventrolateral raphe formations. For abbreviations see "List of abbreviations". Scale bar 500 μm
Fig. 4
Fig. 4
Late appearance of the mesencephalic part of the dorsal raphe nucleus. The issue whether any raphe neurons arise in the midbrain is approached here by comparing 5-HT-immunoreaction with Otx2 in situ hybridization on the same sections, at different stages (Otx2 is known to mark sharply the caudal boundary of the midbrain). a–c Low-magnification images of 5-HT (brown) and Otx2 (blue) signals at the hindbrain–midbrain boundary in paramedian sagittal sections at three different developmental stages. Arrows indicate the midbrain/hindbrain boundary, as marked by Otx2 expression (consistently with parallel fate-mapping data). d–f Higher magnification of the sections in a–c, respectively, showing details of the changing topographic relationship of serotonergic neurons with the midbrain boundary. No midbrain 5-HT cells are observed at E12.5 (d), but a few become apparent at E14.5 (e); these occupy a small triangular area (marked by white arrowhead) in front of the boundary (arrows), where Otx2 expression seems to be partially downregulated. At E18.5 (f) a discrete group of 5-HT-positive cells appears in front of the boundary (arrows; note also the isthmic landmark provided by the trochlear nucleus, IV); these serotonergic elements are located mostly in a periventricular stratum that is Otx2-negative (white arrowhead), though the ventrally adjacent Otx2-positive periaqueductal gray also shows some dispersed serotonergic neurons. This cell group is interpreted by us as mDR, and lies only in the caudal preisthmic midbrain (mesomere 2; compare c). g–i Sagittal sections equivalent to those shown in df (same stages, respectively), but illustrate only 5-HT immunoreacted cells (corresponding low-magnification images are shown in Fig. 5a–c). The midbrain–hindbrain boundary is marked by a dashed line, and black arrowheads indicate the emergent mDR neurons. 4v fourth ventricle, III oculomotor nucleus, IV trochlear nucleus, mlf medial longitudinal fasciculus, xscp decussation of the superior cerebellar peduncle. Scale bar 200 μm in a, 500 μm in b, 400 μm in c, 50 μm in d–e and g–h, 100 μm and in f and i
Fig. 5
Fig. 5
Segmental mapping of the rostral raphe cluster during embryonic development. 5-HT immunoreactive neurons observed in sagittal sections of mouse brains at E12.5 (a, d), E14.5 (b, e), and E18.5 (c, f), with superposed tracing of postulated interrhombomeric boundaries (dashed lines), and our tentative identification of the nuclear primordia (Table 1). Each set of three images read from left to right (e.g., ac) represents a temporal sequence at a given section plane. Arrows mark the midbrain–hindbrain boundary. a–f Rostral cluster at paramedian section level. d–f Rostral cluster at a more lateral level. g–i Details at higher magnification of the paramedian pontine region of Fig. 5a–c, respectively. Note some 5-HT immunopositive cells are always present in r4, mainly in its superficial stratum, though cells with weaker immunoreaction are also observed in the intermediate stratum (arrows in gi). For abbreviations see "List of abbreviations". Scale bar 250 μm in a–f, 100 μm in g–i
Fig. 6
Fig. 6
Segmental mapping of the caudal raphe cluster during embryonic development. 5-HT immunoreactive neurons observed in sagittal sections of mouse brains at E12.5 (a, b), E14.5 (c, d), and E18.5 (e, f), with superposed tracing of postulated interrhombomeric boundaries (dashed lines), and our tentative identification of the nuclear primordia (Table 1). Each set of three images read from top to bottom (e.g., a, c, e) represents a temporal sequence at a given section plane. a, c, e Findings at paramedian section level. b, d, f Findings at a more lateral sagittal section level. g–i Higher magnification of the rhombo-spinal boundary, showing presence of some 5-HT positive cells in the upper cervical spinal cord. Note that these cells are already present at E12.5 (see also arrowheads in c and d). For abbreviations see "List of abbreviations". Scale bar 300 μm in ae, and 100 μm in gi
Fig. 7
Fig. 7
Expression of genes related with the serotonergic phenotype in the rostral raphe cluster in sagittal sections at E12.5. a–h Paramedian sections; the panels show 5-HT immunoreaction plus a particular in situ hybridization (a–e) or only an in situ hybridization (f–h). i–p More lateral section level; i–m show double 5-HT immunoreaction plus in situ hybridization, and n–p only in situ hybridization. q–v Higher magnification of r4 in six equivalent paramedian sections with 5-HT immunoreaction plus in situ hybridization (q–s), or only in situ hybridization (t–v). The riboprobes used are indicated in each case in blue color at the lower left (a–q) or lower right (r–v) corner. Arrow in f points to the mDR nucleus. Scale bar 250 μm in a–p, and 150 μm in q–v
Fig. 8
Fig. 8
Expression of genes related with the serotonergic phenotype in the rostral raphe cluster in sagittal sections at E14.5. a–h Paramedian sections; the panels show 5-HT immunoreaction plus a particular in situ hybridization (a–e) or only an in situ hybridization (f–h). i–p More lateral section level; i–m show double 5-HT immunoreaction plus in situ hybridization, and n–p only in situ hybridization. q–v Higher magnification of r4 in six equivalent paramedian sections with 5-HT immunoreaction plus in situ hybridization (q–s), or only in situ hybridization (t–v). The riboprobes used are indicated in each case in blue color at the lower left (a–q) or lower right (r–v) corner. Arrows in c–h point to the mDR nucleus. Scale bar 250 μm in a–p, and 150 μm in q–v
Fig. 9
Fig. 9
Expression of genes related with the serotonergic phenotype in the rostral raphe cluster in sagittal sections at E18.5. a–h Paramedian sections; the panels show 5-HT immunoreaction plus a particular in situ hybridization (a–e) or only an in situ hybridization (f–h). i–p More lateral section level; i–m show double 5-HT immunoreaction plus in situ hybridization, and n–p only in situ hybridization. q–v Detail of r4 in six equivalent paramedian sections (not identical with a–h) with 5-HT immunoreaction plus in situ hybridization (q–s), or only in situ hybridization (t–v). The riboprobes used are indicated in each case in blue color at the lower left (a–q) or lower right (r–v) corner. Arrows in a–h point to the mDR nucleus. Scale bar 250 μm
Fig. 10
Fig. 10
Expression of genes related with the serotonergic phenotype in the caudal raphe cluster in sagittal sections at E12.5. a–l Each pair of adjacent images represents paramedian and more lateral section levels reacted with a given probe and 5-HT immunoreaction (a–f) or only with an in situ probe (g–l). The relevant genes are indicated in blue color at the upper right corner of each photograph. Scale bar 250 μm
Fig. 11
Fig. 11
Expression of genes related with the serotonergic phenotype in the caudal raphe cluster in sagittal sections at E14.5. a–l Each pair of adjacent images represents paramedian and more lateral section levels reacted with a given probe and 5-HT immunoreaction (a–f) or only with an in situ probe (g–l). The relevant genes are indicated in blue color at the upper right corner of each photograph. Scale bar 250 μm
Fig. 12
Fig. 12
Expression of genes related with the serotonergic phenotype in the caudal raphe cluster in sagittal sections at E18.5. a–l Each pair of adjacent images represents paramedian and more lateral section levels reacted with a given probe and 5-HT immunoreaction (a–f) or only with an in situ probe (g–l). The relevant genes are indicated in blue color at the upper right corner of each photograph. Scale bar 300 μm
Fig. 13
Fig. 13
Schematic synthesis of the studied molecular profile of the mouse raphe nuclei during embryonic development. Medial and lateral raphe nuclei are represented at three different embryonic stages, with a corresponding pair of schemata of results obtained either next to the midline or more laterally: E12.5 (a, b), E14.5 (c, d), E18.5 (e, f). Below each rectangular schema of the segmented hindbrain, with mapped raphe populations filled-in in gray, the respective intensity of gene expression for eight color-coded markers is represented by different color hue. Underneath is added a realistic schema of the corresponding sagittal section thus mapped. Black asterisks in c and e represent the expanding mDR nucleus
Fig. 14
Fig. 14
Selected results of a search done in the Allen Adult and Developing Mouse Brain Atlases, looking for mouse genes with restricted expression patterns within the raphe nuclei (irrespective of other domains of expression). The gene tag is indicated at the lower left corner of each panel. a–d Genes with expression restricted to some specific raphe subgroups of the rostral and caudal clusters. e, f Genes with expression restricted to only some nuclei of the rostral cluster. g–j Genes with expression restricted to only some nuclei of the caudal cluster. The stages are P4 (d, f, h, i, j), P14 (a–c) or P56 (e, g). Scale bar 500 μm
Fig. 15
Fig. 15
Comparison of old and new raphe classifications. a Schematic median projection of paramedian raphe serotonergic cells taken from a postnatal mouse specimen, showing relative cell densities. b Schema of the conventional identification of 9 paramedian raphe nuclei across midbrain, pontine and medullary territories, the latter delimited roughly according to the apparent external bulge of the pons; the thick red lines mark approximately the postulated ‘pontine’ boundaries, though there is some variation between sources (compare text Fig. 10 in Swanson ; text Fig. 0 in Paxinos and Franklin ; see also Dong and The Allen Institute for Brain Science 2008). c Schema illustrating present results, ascribing 25 paramedian serotonergic populations to discrete neuromeric origins. The limits of the midbrain (M), developmental hindbrain (H) units containing the basilar pons (pons proper) and the spinal cord (SC) are marked in red. Laterally displaced cell groups are not represented in this panel

References

    1. Abrams JK, Johnson PL, Hollis JH, Lowry CA. Anatomic and functional topography of the dorsal raphe nucleus. Ann N Y Acad Sci. 2004;1018:46–57. doi: 10.1196/annals.1296.005. - DOI - PubMed
    1. Agnati LF, Fuxe K, Hökfelt T, Benfenati F, Calza L, Johansson O, De Mey J. Morphometric characterization of transmitter-identified nerve cell groups: analysis of mesencephalic 5-HT nerve cell bodies. Brain Res Bull. 1982;9:45–51. doi: 10.1016/0361-9230(82)90119-8. - DOI - PubMed
    1. Aitken AR, Törk I. Early development of serotonin-containing neurons and pathways as seen in wholemount preparations of the fetal rat brain. J Comp Neurol. 1988;274:32–47. doi: 10.1002/cne.902740105. - DOI - PubMed
    1. Araneda S, Gysling K, Calas A. Raphe serotonergic neurons projecting to the olfactory bulb contain galanin or somatostatin, but not neurotensin. Brain Res Bull. 1999;49:209–214. doi: 10.1016/S0361-9230(99)00055-6. - DOI - PubMed
    1. Aroca P, Puelles L. Postulated boundaries and differential fate in the developing rostral hindbrain. Brain Res Brain Res Rev. 2005;49:179–190. doi: 10.1016/j.brainresrev.2004.12.031. - DOI - PubMed

Publication types

MeSH terms