. 2013 Jan 1;73(1):235-45.
doi: 10.1158/0008-5472.CAN-12-1739. Epub 2012 Oct 10.

Inhibiting interactions of lysine demethylase LSD1 with snail/slug blocks cancer cell invasion

Affiliations

Inhibiting interactions of lysine demethylase LSD1 with snail/slug blocks cancer cell invasion

Giovanna Ferrari-Amorotti et al. Cancer Res. .

Abstract

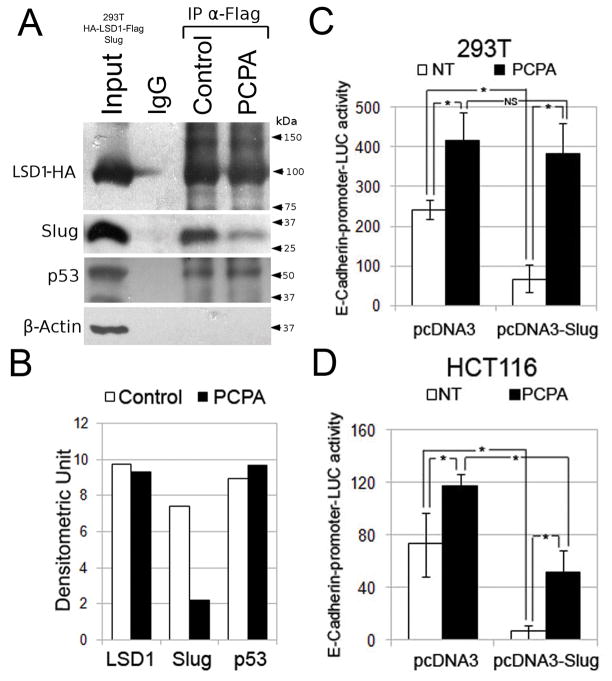
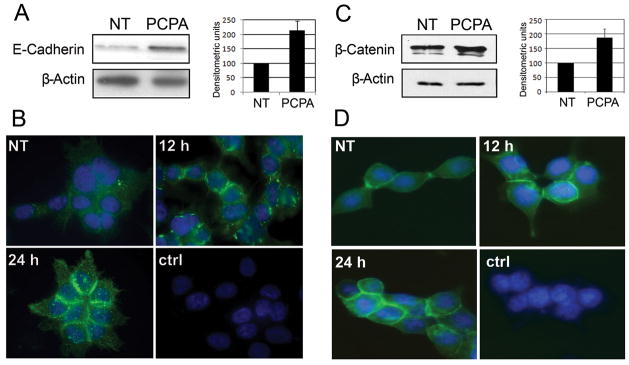
The process of epithelial-mesenchymal transition (EMT) which is required for cancer cell invasion is regulated by a family of E-box-binding transcription repressors, which include Snail (SNAIL1) and Slug (SNAI2). Snail appears to repress the expression of the EMT marker E-cadherin by epigenetic mechanisms dependent on the interaction of its N-terminal SNAG domain with chromatin-modifying proteins including lysine-specific demethylase 1 (LSD1/KDM1A). We assessed whether blocking Snail/Slug-LSD1 interaction by treatment with Parnate, an enzymatic inhibitor of LSD1, or TAT-SNAG, a cell-permeable peptide corresponding to the SNAG domain of Slug, suppresses the motility and invasiveness of cancer cells of different origin and genetic background. We show here that either treatment blocked Slug-dependent repression of the E-cadherin promoter and inhibited the motility and invasion of tumor cell lines without any effect on their proliferation. These effects correlated with induction of epithelial and repression of mesenchymal markers and were phenocopied by LSD1 or Slug downregulation. Parnate treatment also inhibited bone marrow homing/engraftment of Slug-expressing K562 cells. Together, these studies support the concept that targeting Snail/Slug-dependent transcription repression complexes may lead to the development of novel drugs selectively inhibiting the invasive potential of cancer cells.


Conflict of interest statement

Disclosure of Potential Conflicts of Interest: No potential conflicts of interests were disclosed.

Figures

Figure 1
Figure 1. Effect of Parnate on Slug-LSD1 interaction and Slug-dependent repression of the E-cadherin promoter
(A and B) Western blot and densitometry of HA-tagged LSD1, Slug, p53 and β-Actin expression in total lysate or anti-FLAG-LSD1 IPs from 293T cells co-expressing LSD1 and Slug; histograms show E-cadherin-driven luciferase activity in untreated and Parnate-treated 293T (C) and empty vector-transfected or Slug-expressing HCT116 (D) cells. Representative of three experiments performed in triplicate; * denotes p values < 0.05.
Figure 2
Figure 2. Effect of Parnate on migration, invasion and proliferation of tumor cell lines
(A and B) microphotographs show repopulation of wounded area of untreated and Parnate-treated HCT116 and HTLA230 cells; on the right, histograms represent accurate wound measurements taken at 0 and 72h for each treatment to calculate the migration rate; data are presented as means ± S.D. from two independent experiments; (C) histograms show invasion inhibition (expressed as % of untreated cells taken as 100) by Parnate treatment; microphotographs show representative fields of Giemsa-stained lower membranes of the Boyden chambers; (D) histograms show number of untreated and Parnate-treated cells counted by trypan blue exclusion; representative of three independent experiments performed in triplicate. Asterisks indicate statistical significance (p<0.05, Student’s t test).
Figure 3
Figure 3. Effect of Parnate on Slug-LSD1 interaction and bone marrow homing of Slug-expressing K562 cells
(A) western blots (left) and densitometry (right) of Slug expression in total lysate (at shorter exposure’s time) and anti-LSD1 IPs of untreated and Parnate-treated Slug-K562 cells; (B and C) histograms show: number of GFP-positive (B) and clonogenic (C) cells in the bone marrow of NOD/SCID mice (n=5) 24 h after injection with untreated or Parnate-treated (16 h, 100μM) Slug-K562 cells (2 × 10⁶ cells/mouse). For colony formation assays, 5 × 10⁴ cells/plate (in triplicate) were plated in methylcellulose medium without cytokines to allow growth of K562 cells only. Colonies were counted five days after plating. Data are reported as the mean + S.D. Asterisks indicate statistical significance (p<0.05, Student’s t test); (D) histogram shows CD44 levels (detected by flow cytometry) in untreated and Parnate-treated parental and Slug-K562 cells. Representative of two experiments; inset shows Slug expression in parental and Slug-expressing K562 cells.
Figure 4
Figure 4. Expression of EMT markers detected by real time Q-PCR in Parnate-treated (12 hours) tumor cells
Data represent the mean + SD of two experiments. Changes in the expression induced by Parnate treatment are all statistically significant except for those of Occludin and Desmoplakin in Colo205 cells.
Figure 5
Figure 5. Expression of E-cadherin and β-Catenin in Parnate-treated HCT116 cells
(A,C) Western blot (left) and densitometry (right) of E-Cadherin (A) and β-Catenin (C) expression in untreated (NT) and Parnate-treated (100 μM, 24 h) HCT116 cells. Levels of β-actin were measured as loading control; (B,D) Immunofluorescence micrographs of E-Cadherin (B) and β-Catenin (D) expression in untreated (NT) and Parnate-treated (12 and 24 h) HCT116 cells. Ctrl represents cells treated only with the fluorescent secondary antibody. Nuclei were stained with DAPI. Original magnification was 100X.
Figure 6
Figure 6. Effect of TAT-SNAG peptide on: Slug-LSD1 interaction, Slug-dependent repression of the E-cadherin promoter, migration, invasion, proliferation and EMT marker levels of HCT116 cells
(A) Western blot (left) and densitometry (right) of HA-tagged LSD1, Slug and p53 expression in total lysate or peptide (TAT or TAT-SNAG)-treated anti-FLAG-LSD1 IPs from 293T cells co-expressing LSD1 and Slug; (B) histogram shows E-Cadherin-driven luciferase activity in HCT116 cells, untreated or treated with the TAT-SNAG or the TAT peptide. Data (mean ± S.D. of two experiments performed in duplicate) are presented as % change in luciferase activity compared to that of cells transfected with the empty vector only taken as 100. * indicates that the increase in luciferase activity of TAT-SNAG-treated cells is statistically significant; (C) microphotographs show repopulation of wounded area of TAT-SNAG- or TAT peptide-treated cells; on the right, histograms represent accurate measure of wounds taken at 0 and 72h for each treatment to calculate the migration rate; data are means ± S.D. from two independent experiments; (D) histogram shows invasion inhibition (expressed as % of untreated (NT) cells taken as 100) in TAT-SNAG- or TAT-peptide-treated HCT116 cells; microphotographs show representative fields of Giemsa-stained lower membranes of the Boyden chambers; (E) histogram shows number of untreated and TAT-SNAG- or TAT-peptide-treated cells counted by trypan blue exclusion; representative of three independent experiments performed in triplicate; (F) expression of EMT markers detected by real time Q-PCR in untreated (NT) and TAT-SNAG-treated (12 hours) HCT116 cells. Data represent the mean + SD of two experiments. Changes in RNA levels induced by TAT-SNAG treatment are all statistically significant (p<0.05; Student’s t test); (G) E-Cadherin expression in TAT-SNAG-treated HCT116 cells. Western blot (left) and densitometry (right) of E-Cadherin levels in untreated (NT) and TAT-SNAG-treated (24 h) HCT116 cells. Expression of β-actin was measured as loading control.

References

    1. Steeg PS. Tumor metastasis: mechanistic insights and clinical challenges. Nat Medicine. 2006;12:895–904. - PubMed
    1. Valastyan S, Weinberg RA. Tumor metastasis: molecular insights and evolving paradigms. Cell. 2011;147:275–92. - PMC - PubMed
    1. Gupta GP, Massagué J. Cancer metastasis: building a framework. Cell. 2006;127:679–95. - PubMed
    1. Martin-Belmonte F, Perez-Moreno M. Epithelial cell polarity, stem cells and cancer. Nat Rev Cancer. 2012;12:23–38. - PubMed
    1. Zeisberg M, Neilson EG. Biomarkers for epithelial-mesenchymal transitions. J Clin Invest. 2009;119:1429–37. - PMC - PubMed

Publication types