. 2012 Oct;24(10):3967-81.
doi: 10.1105/tpc.112.103044. Epub 2012 Oct 9.

Spatiotemporal regulation of lateral root organogenesis in Arabidopsis by cytokinin

Affiliations

Spatiotemporal regulation of lateral root organogenesis in Arabidopsis by cytokinin

Agnieszka Bielach et al. Plant Cell. 2012 Oct.

Abstract

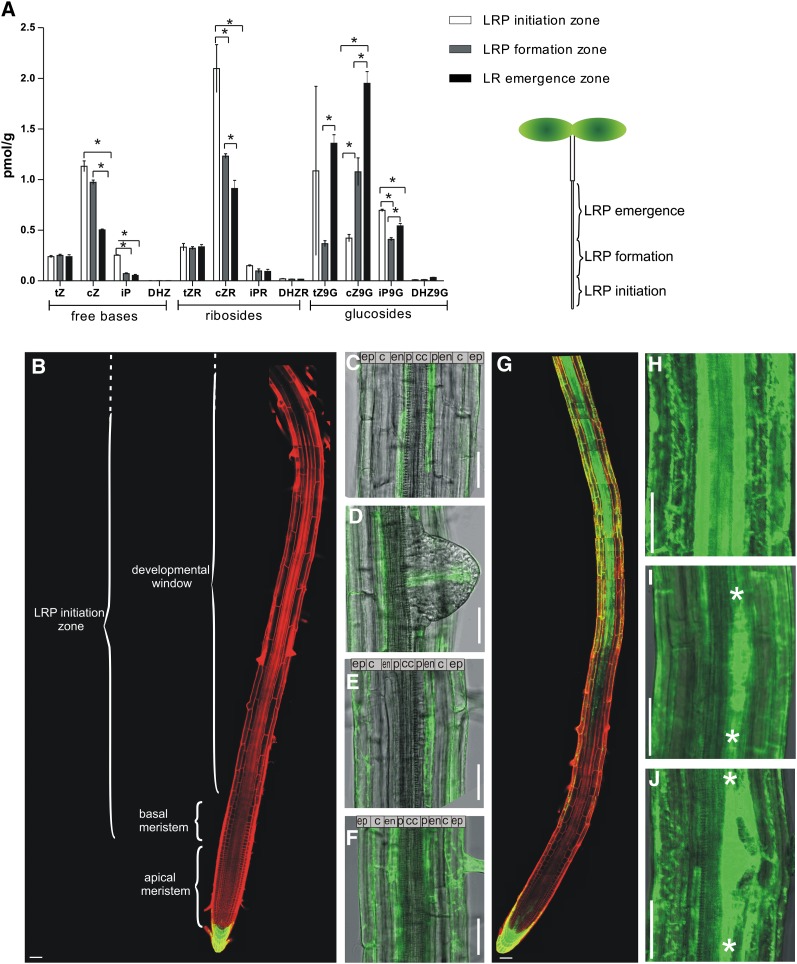
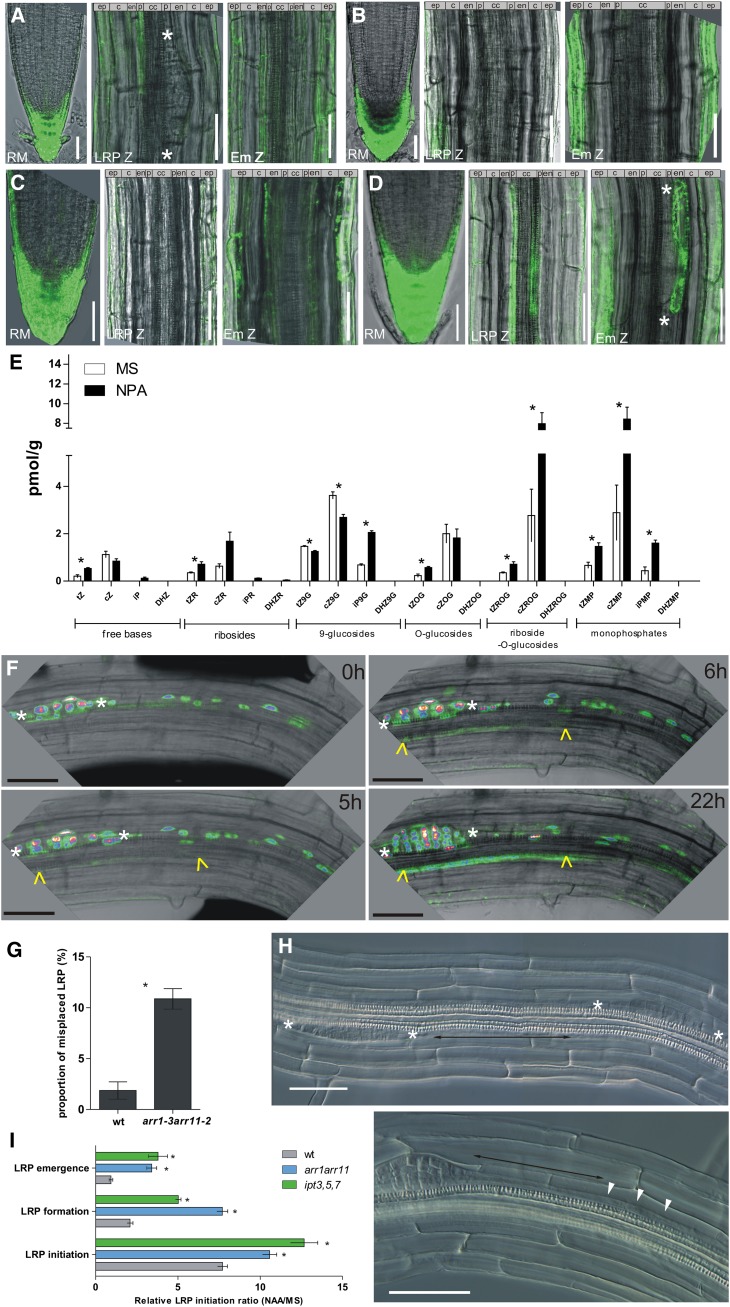
The architecture of a plant's root system, established postembryonically, results from both coordinated root growth and lateral root branching. The plant hormones auxin and cytokinin are central endogenous signaling molecules that regulate lateral root organogenesis positively and negatively, respectively. Tight control and mutual balance of their antagonistic activities are particularly important during the early phases of lateral root organogenesis to ensure continuous lateral root initiation (LRI) and proper development of lateral root primordia (LRP). Here, we show that the early phases of lateral root organogenesis, including priming and initiation, take place in root zones with a repressed cytokinin response. Accordingly, ectopic overproduction of cytokinin in the root basal meristem most efficiently inhibits LRI. Enhanced cytokinin responses in pericycle cells between existing LRP might restrict LRI near existing LRP and, when compromised, ectopic LRI occurs. Furthermore, our results demonstrate that young LRP are more sensitive to perturbations in the cytokinin activity than are developmentally more advanced primordia. We hypothesize that the effect of cytokinin on the development of primordia possibly depends on the robustness and stability of the auxin gradient.


Figures

Figure 1.
Figure 1.
Distribution of Cytokinin and Cytokinin Response in Roots. (A) Quantification of cytokinin levels in the zones of LRP initiation zone, formation, and emergence. Error bars denote se (*P < 0.05; Student’s t test; n = 3). (B) to (F) TCS:GFP expression in 8-d-old untreated roots detected in the root cap, but not in the root meristem, basal meristem, and developmental window (B); in the individual xylem pole pericycle cells between developing young primordia (C); in the provasculature tissue in emerging LRPs (D); in the endodermal cells adjacent to early-stage LRPs (E); and continuously in the endodermis of the emerging primordium zone (F). (G) to (J) TCS:GFP expression in 8-d-old roots treated for 16 h with 10 μM benzyl adenine induced in the provasculature of the root, but not basal, meristem (G) and in all tissues of the differentiation zone ([G] and [H]), including primordia at all developmental stages ([I] and [J]). Plasma membranes were visualized by propidium iodide staining. c, cortex; cc, central cylinder; cZ, cis-zeatin; cZ9G, cis-zeatin-9-glucoside; cZR, cis-zeatin riboside; DHZ, dihydrozeatin; DHZ9G, dihydrozeatin-9-glucoside; DHZR, dihydrozeatin riboside; en, endodermis; ep, epidermis; iP, isopentenyladenine; iP9G; isopentenyladenine-9-glucoside; iPR, isopentenyl adenosine; p, pericycle; tZ, trans-zeatin; tZ9G, trans-zeatin-9-glucoside; tZR, trans-zeatin riboside. White asterisks indicate borders of LRPs. Bars = 50 μm.
Figure 2.
Figure 2.
Cytokinin Response in the Pericycle Cells. (A) and (B) TCS:GFP signal in pericycle cells of 7-d-old roots without treatment (A) and on media supplemented with 10 μM NPA (B). (C) and (D) TCS:GFP expression in pericycle cells of 3-d-old roots without LRPs (C) and 4-d-old roots with one or two initiated LRPs. Weak TCS signal present in xylem pole pericycle cells and in the endodermis adjacent to LRP (D). (E) Cytokinin measurements in roots, excluding the root meristem of seedlings grown on control medium (white) and in the presence of 10 μM NPA (black). Error bars denote se (*P < 0.05; Student’s t test; n = 3). (F) Real-time monitoring of TCS:GFP x DR5:3XVENUS-N7 reporter in pericycle cells after LRP initiation. White asterisks and yellow arrowheads indicate LRPs at the early initiation stage in pericycle cells visualized by nuclear-localized DR5:3XVENUS-N7 and the TCS:GFP signal, respectively. (G) and (H) Defective LRI positioning in 7-d-old seedlings of the arr1 arr11 mutant. Proportion of misplaced per total number of LRPs (wild type, n = 218; arr1-3 arr11-2, n = 267) from 18 roots each. Error bars denote se (*P < 0.05; Student’s t test) (G). One pericycle cell distance between two LRPs (H). (I) Auxin-induced LRP initiation in arr1 arr11 and ipt3 ipt5 ipt7 mutants. In the mutant background, 25 h of treatment with 1 μM 1-naphthaleneacetic acid (NAA) induces LRP initiation along the whole root, whereas in control roots, induction is restricted mainly to the LRP initiation zone. Error bars denote se (*P < 0.05; Mann-Whitney test; n = 15 roots). White asterisks indicate borders of LRPs. cZ, cis,zeatin; cZ9G; cis-zeatin-9-glucoside; cZMP, cis-zeatin riboside monophosphate; cZOG, cis-zeatin-O-glucoside; cZR, cis-zeatin riboside; cZROG, cis-zeatin riboside-O-glucoside; DHZ, dihydrozeatin; DHZ9G, dihydrozeatin- 9-glucoside; DHZMP, dihydrozeatin riboside monophosphate; DHZOG, dihydrozeatin-O-glucoside; DHZR, dihydrozeatin riboside; DHRZOG, dihydrozeatin riboside-O-glucoside; DHZR, dihydrozeatin riboside; Em Z, zone of LRP emergence; iP, isopentenyladenine; iP9G; isopentenyladenine-9-glucoside; iPMP, isopentenyl adenosine monophosphate; iPR, isopentenyl adenosine; LRP Z, zone of LRP initiation; RM, root meristem; tZ, trans-zeatin; tZ9G, trans-zeatin-9-glucoside; tZMP, trans-zeatin riboside monophosphate; tZOG, trans-zeatin-O-glucoside; tZROG, trans-zeatin riboside-O-glucoside; tZR, trans-zeatin riboside; wt, the wild type. Bars = 50 μm.
Figure 3.
Figure 3.
Expression Pattern of GAL4-GFP Enhancer Trap Lines. Activator lines exhibit expression in the root differentiation and early elongation zones, including epidermis/cortex (J2601, N9193, J2092,, M0028, and J0951), cortex/endodermis (N9094), provasculature (J1701), or pericycle (J0121), while in lines J0671 and J3611, expression occurs in the mature differentiated root zones. Insets display enlarged basal meristems. Bars = 50 μm.
Figure 4.
Figure 4.
Spatiotemporal Effect of IPT Expression on Root Growth and LRI. (A) Inhibited root growth in lines with IPT expressed in the root differentiation and elongation zones (J2601>>IPT, N9193>>IPT, J2092>>IPT, N9094>>IPT, M0028>>IPT, J0121>>IPT, J0951>>IPT, and J1701>>IPT). Error bars denote se (*P < 0.05; Mann-Whitney test, n = 10 roots). (B) LRP density in lines with IPT expression in the basal meristem. The lines J2601>>IPT, N9193>>IPT, J2092>>IPT, N9094>>IPT, M0028>>IPT, J1701>>IPT, and J2351>>IPT exhibit reduced LRP density. Error bars denote se (*P < 0.05; Mann-Whitney test; n = 10 roots). ns, not significant. (C) Cytokinin levels in control J0121>>Col and J0121>>IPT roots. Error bars denote se (*P < 0.05; Student’s t test; n = 3). cZ, cis-zeatin; cZ9G, cis-zeatin-9-glucoside; cZR, cis-zeatin riboside; DHZ, dihydrozeatin; DHZ9G, dihydrozeatin-9-glucoside; DHZR, dihydrozeatin riboside; iP, isopentenyladenine; iP9G, isopentenyladenine-9-glucoside; iPR, isopentenyl adenosine; tZ, trans-zeatin; tZ9G, trans-zeatin-9-glucoside; tZR, trans-zeatin riboside.
Figure 5.
Figure 5.
Cytokinin Effects on LRP Development. Real-time monitoring of LRP development on control medium (Mock) and in the presence of 0.1 μM benzyl adenine, when cytokinin was applied at stage I (A) or stage IV (B). DR5:RFP reporter was used to visualize auxin maxima and developmental stages of LRPs. Bars = 50 μm.

References

    1. Beeckman T., Burssens S., Inzé D. (2001). The peri-cell-cycle in Arabidopsis. J. Exp. Bot. 52(Spec Issue): 403–411 - PubMed
    1. Benková E., Bielach A. (2010). Lateral root organogenesis - From cell to organ. Curr. Opin. Plant Biol. 13: 677–683 - PubMed
    1. Benková E., Michniewicz M., Sauer M., Teichmann T., Seifertová D., Jürgens G., Friml J. (2003). Local, efflux-dependent auxin gradients as a common module for plant organ formation. Cell 115: 591–602 - PubMed
    1. Birnbaum K., Jung J.W., Wang J.Y., Lambert G.M., Hirst J.A., Galbraith D.W., Benfey P.N. (2005). Cell type-specific expression profiling in plants via cell sorting of protoplasts from fluorescent reporter lines. Nat. Methods 2: 615–619 - PubMed
    1. Blilou I., Xu J., Wildwater M., Willemsen V., Paponov I., Friml J., Heidstra R., Aida M., Palme K., Scheres B. (2005). The PIN auxin efflux facilitator network controls growth and patterning in Arabidopsis roots. Nature 433: 39–44 - PubMed

Publication types

MeSH terms

Associated data

LinkOut - more resources