

Review
doi: 10.1104/pp.112.208298.
Epub 2012 Oct 10.
The influence of climate change on global crop productivity
Affiliations
- PMID: 23054565
- PMCID: PMC3510102
- DOI: 10.1104/pp.112.208298
Item in Clipboard
Review
The influence of climate change on global crop productivity
Plant Physiol.
2012 Dec.
No abstract available
Figures
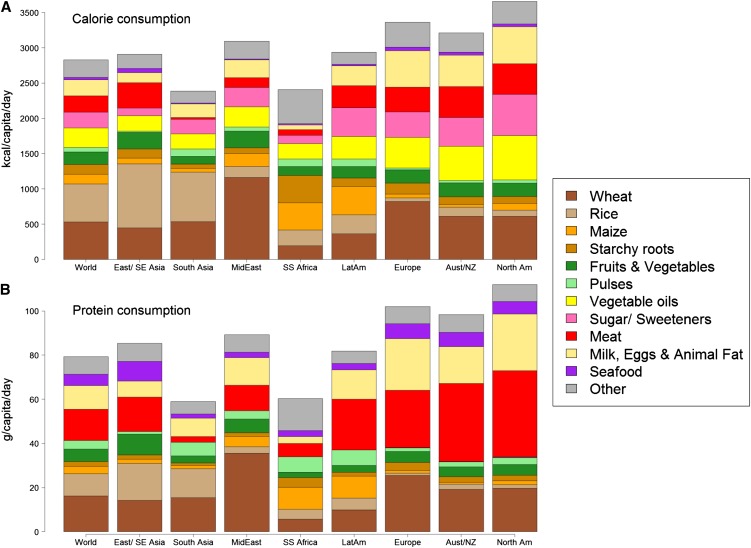
Daily calorie consumption (A) and protein supply (B) from various food sources for the globe and eight regions around the world. Data source is FAO (2012).
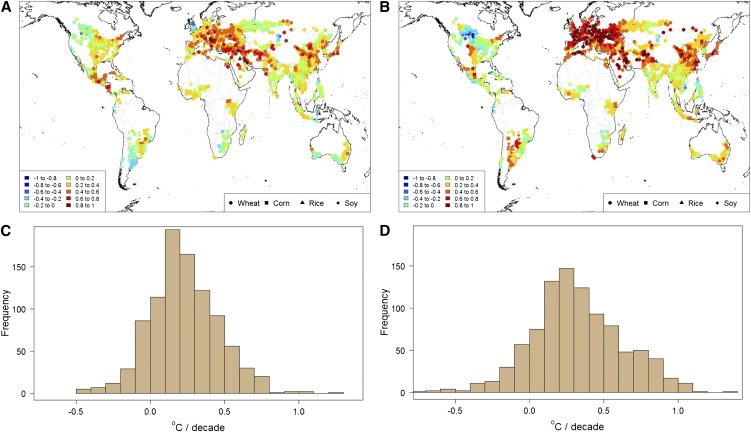
Decadal warming trends (°C per decade) since 1980 in growing season daily Tmin (left) and Tmax (right) in major global cereal cropping regions, displayed on maps (A and B) and as histograms (C and D). T were averaged over the crop season (taken from Sacks et al., 2010), and points were selected randomly from one-half-degree grid cells having at least 10% harvested area in one of the four major cereal crops (wheat, corn, rice, soybean; based on Monfreda et al., 2008). Weather data were generated by interpolating anomalies of surface weather station data (from www.ncdc.noaa.gov ) relative to climate normals in the WorldClim database (www.worldclim.org ). Different symbols indicate the predominant crop for each grid cell.
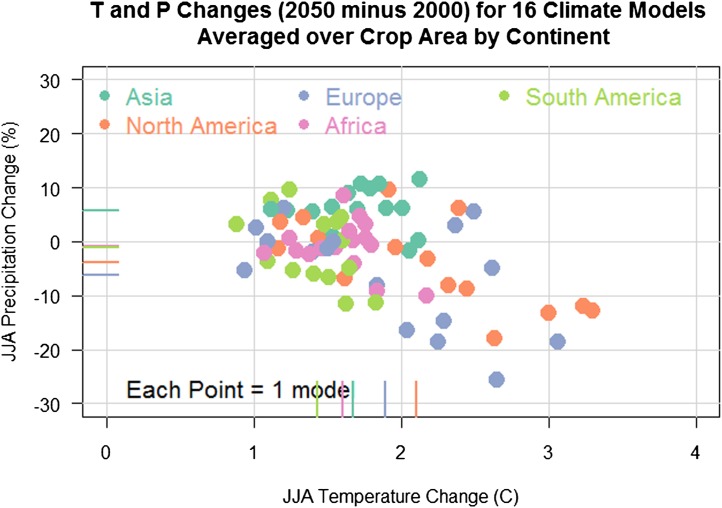
Model-projected differences between 2040 to 2060 and 1990 to 2010 in June to August (JJA) T and P for cropland areas by continent. Points represent projections from a single model for each region, while hatches indicate model averages for each region. Values are weighted area averages, with weights equal to the fraction of each grid cell with agriculture based on (Ramankutty et al., 2008). Data source for climate projections is http://gdo-dcp.ucllnl.org/downscaled_cmip3_projections/ .
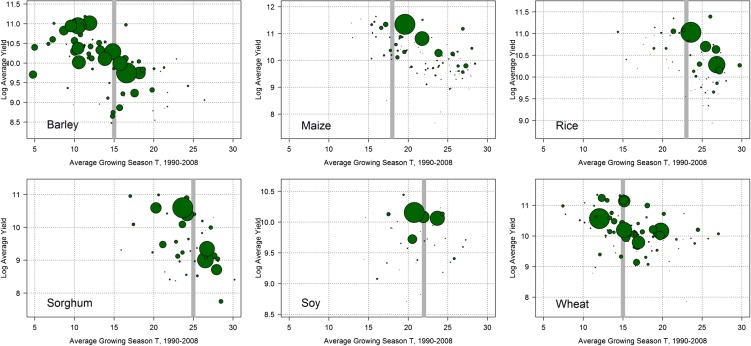
Average yields for six major crops plotted against average growing season T as computed by Lobell et al. (2011). Each dot represents a single country, with the size of the dot proportional to total national production for that crop. Gray vertical lines indicate optimal T for yields based on experiments, as reported by Hatfield et al. (2011). The highest national yields are typically observed close to the optimum T, with lower average yields for warmer countries. Also apparent is that many countries that are major producers are currently above optimal T.
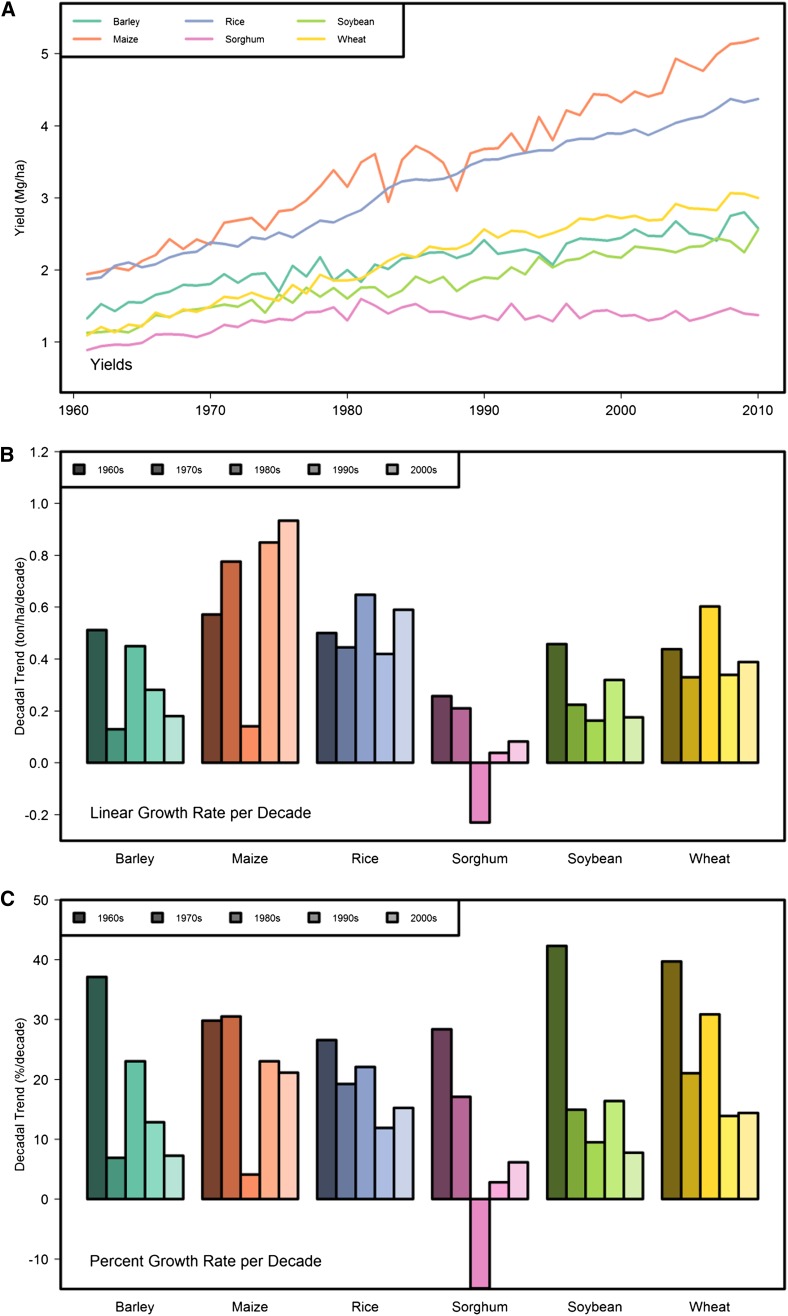
A, Observed global average yields since 1961 for six major crops. B, Linear rates of yield change per decade for each decade (based on the slope of the regression line fit to 10 years of data [e.g. 1971–1980]). C, Percentage yield changes per decade for each decade. Data source is FAO (2012).
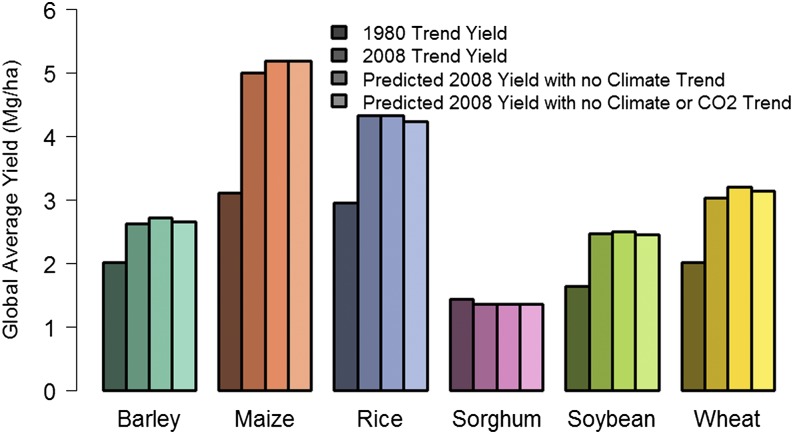
Trend yields in 1980 and 2008 (based on the regression line fit to annual data for 1980–2008), along with estimated yields for counterfactual scenarios of no climate trends since 1980 or no climate or CO2 trends since 1980. These findings are based on results from Lobell et al. (2011).
References
-
- Ainsworth EA, Long SP. (2005) What have we learned from 15 years of free-air CO2 enrichment (FACE)? A meta-analytic review of the responses of photosynthesis, canopy properties and plant production to rising CO2. New Phytol 165: 351–371 - PubMed
-
- Alexander LV, Zhang X, Peterson TC, Caesar J, Gleason B, Klein Tank A, Haylock M, Collins D, Trewin B, Rahimzadeh F. (2006) Global observed changes in daily climate extremes of temperature and precipitation. J Geophys Res 111: D05109
-
- Biswas DK, Xu H, Li YG, Sun JZ, Wang XZ, Han XG, Jiang GM. (2008) Genotypic differences in leaf biochemical, physiological and growth responses to ozone in 20 winter wheat cultivars released over the past. Glob Change Biol 14: 46–59
-
- Brown RA, Rosenberg NJ. (1997) Sensitivity of crop yield and water use to change in a range of climatic factors and CO2 concentrations: a simulation study applying EPIC to the central USA. Agric For Meteorol 83: 171–203
-
- Bruinsma J. (2009) The resource outlook to 2050. In Expert Meeting on How to Feed the World in 2050. Food and Agriculture Organization of the United Nations, Rome, pp 1–33
Publication types
MeSH terms
Substances
LinkOut - more resources
Full Text Sources
Medical
