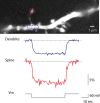
Cortical dendritic spine heads are not electrically isolated by the spine neck from membrane potential signals in parent dendrites
- PMID: 23054810
- PMCID: PMC3888368
- DOI: 10.1093/cercor/bhs320
Cortical dendritic spine heads are not electrically isolated by the spine neck from membrane potential signals in parent dendrites
Abstract
The evidence for an important hypothesis that cortical spine morphology might participate in modifying synaptic efficacy that underlies plasticity and possibly learning and memory mechanisms is inconclusive. Both theory and experiments suggest that the transfer of excitatory postsynaptic potential signals from spines to parent dendrites depends on the spine neck morphology and resistance. Furthermore, modeling of signal transfer in the opposite direction predicts that synapses on spine heads are not electrically isolated from voltages in the parent dendrite. In sharp contrast to this theoretical prediction, one of a very few measurements of electrical signals from spines reported that slow hyperpolarizing membrane potential changes are attenuated considerably by the spine neck as they spread from dendrites to synapses on spine heads. This result challenges our understanding of the electrical behavior of spines at a fundamental level. To re-examine the specific question of the transfer of dendritic signals to synapses of spines, we took advantage of a high-sensitivity Vm-imaging technique and carried out optical measurements of electrical signals from 4 groups of spines with different neck length and simultaneously from parent dendrites. The results show that spine neck does not filter membrane potential signals as they spread from the dendrites into the spine heads.
Keywords: cerebral cortex; cortical spines; optical recording; plasticity; voltage-sensitive dyes.
Figures


Similar articles
-
Electrical behaviour of dendritic spines as revealed by voltage imaging.Nat Commun. 2015 Oct 5;6:8436. doi: 10.1038/ncomms9436. Nat Commun. 2015. PMID: 26436431 Free PMC article.
-
Voltage compartmentalization in dendritic spines in vivo.Science. 2022 Jan 7;375(6576):82-86. doi: 10.1126/science.abg0501. Epub 2021 Nov 11. Science. 2022. PMID: 34762487 Free PMC article.
-
Impact of subthreshold membrane potential on synaptic responses at dendritic spines of layer 5 pyramidal neurons in the prefrontal cortex.J Neurophysiol. 2014 May;111(10):1960-72. doi: 10.1152/jn.00590.2013. Epub 2014 Jan 29. J Neurophysiol. 2014. PMID: 24478153 Free PMC article.
-
Electrically coupled but chemically isolated synapses: dendritic spines and calcium in a rule for synaptic modification.Prog Neurobiol. 1988;31(6):507-28. doi: 10.1016/0301-0082(88)90013-5. Prog Neurobiol. 1988. PMID: 2849143 Review.
-
The function of dendritic spines: a review of theoretical issues.Behav Neural Biol. 1985 Sep;44(2):151-85. doi: 10.1016/s0163-1047(85)90170-0. Behav Neural Biol. 1985. PMID: 2415102 Review.
Cited by
-
Imaging with organic indicators and high-speed charge-coupled device cameras in neurons: some applications where these classic techniques have advantages.Neurophotonics. 2015 Apr;2(2):021005. doi: 10.1117/1.NPh.2.2.021005. Epub 2014 Dec 22. Neurophotonics. 2015. PMID: 26157996 Free PMC article. Review.
-
Contribution of individual excitatory synapses on dendritic spines to electrical signaling.Front Neurosci. 2025 Jul 29;19:1620654. doi: 10.3389/fnins.2025.1620654. eCollection 2025. Front Neurosci. 2025. PMID: 40799917 Free PMC article.
-
Contribution of sublinear and supralinear dendritic integration to neuronal computations.Front Cell Neurosci. 2015 Mar 24;9:67. doi: 10.3389/fncel.2015.00067. eCollection 2015. Front Cell Neurosci. 2015. PMID: 25852470 Free PMC article. Review.
-
Comparative Evaluation of Genetically Encoded Voltage Indicators.Cell Rep. 2019 Jan 15;26(3):802-813.e4. doi: 10.1016/j.celrep.2018.12.088. Cell Rep. 2019. PMID: 30650368 Free PMC article.
-
Simultaneous Sodium and Calcium Imaging from Dendrites and Axons.eNeuro. 2015 Nov 9;2(5):ENEURO.0092-15.2015. doi: 10.1523/ENEURO.0092-15.2015. eCollection 2015 Sep-Oct. eNeuro. 2015. PMID: 26730401 Free PMC article.
References
-
- Acker CD, Yan P, Loew LM. Single-voxel recording of voltage transients in dendritic spines. Biophys J. 2011;101:L11–L13. doi:10.1016/j.bpj.2011.06.021. - DOI - PMC - PubMed
-
- Antic S, Major G, Zecevic D. Fast optical recordings of membrane potential changes from dendrites of pyramidal neurons. J Neurophysiol. 1999;82:1615–1621. - PubMed
-
- Antic S, Wuskell JP, Loew L, Zecevic D. Functional profile of the giant metacerebral neuron of Helix aspersa: temporal and spatial dynamics of electrical activity in situ. J Physiol. 2000;527:55–69. doi:10.1111/j.1469-7793.2000.00055.x. - DOI - PMC - PubMed
-
- Antic SD. Action potentials in basal and oblique dendrites of rat neocortical pyramidal neurons. J Physiol. 2003;550:35–50. doi:10.1113/jphysiol.2002.033746. - DOI - PMC - PubMed

