. 2012 Dec 7;279(1748):4734-9.
doi: 10.1098/rspb.2012.2085. Epub 2012 Oct 10.

Early warning signals and the prosecutor's fallacy

Affiliations

Early warning signals and the prosecutor's fallacy

Carl Boettiger et al. Proc Biol Sci. .

Abstract

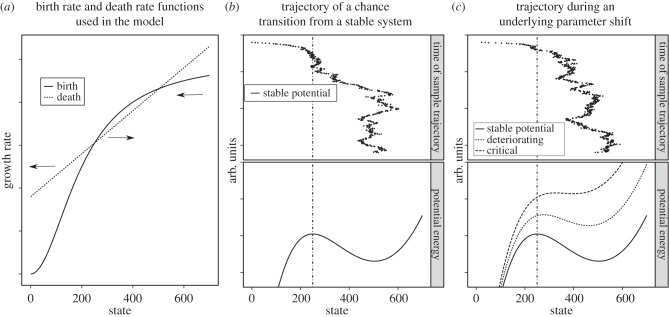
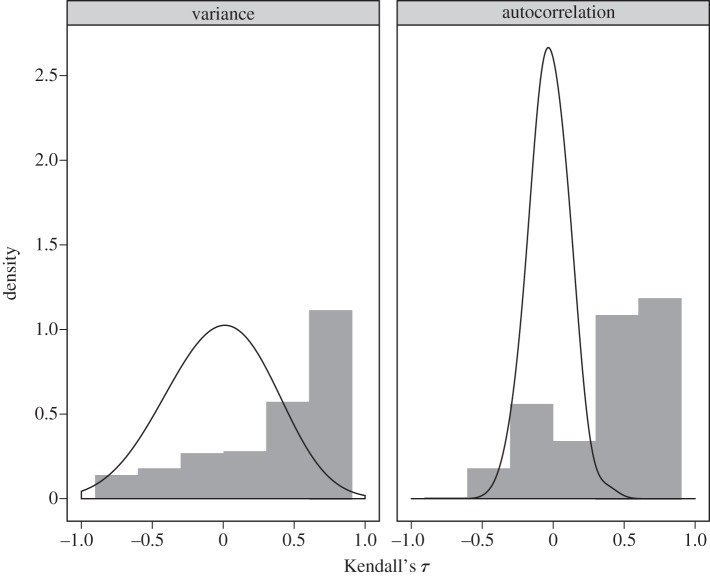
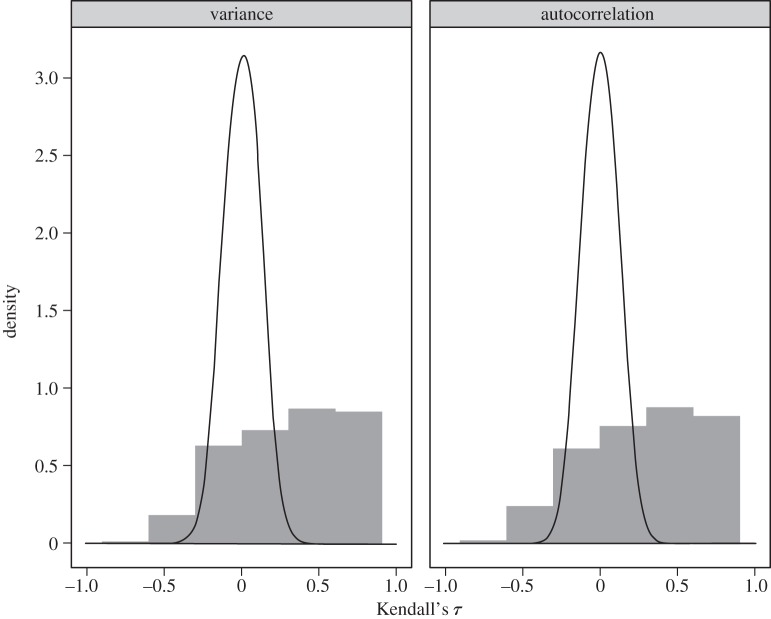
Early warning signals have been proposed to forecast the possibility of a critical transition, such as the eutrophication of a lake, the collapse of a coral reef or the end of a glacial period. Because such transitions often unfold on temporal and spatial scales that can be difficult to approach by experimental manipulation, research has often relied on historical observations as a source of natural experiments. Here, we examine a critical difference between selecting systems for study based on the fact that we have observed a critical transition and those systems for which we wish to forecast the approach of a transition. This difference arises by conditionally selecting systems known to experience a transition of some sort and failing to account for the bias this introduces--a statistical error often known as the prosecutor's fallacy. By analysing simulated systems that have experienced transitions purely by chance, we reveal an elevated rate of false-positives in common warning signal statistics. We further demonstrate a model-based approach that is less subject to this bias than those more commonly used summary statistics. We note that experimental studies with replicates avoid this pitfall entirely.


Figures

Figure 1.
Figure 1.
The prosecutor's fallacy. (a) Plot of the model functions shown in equation (2.1) with parameters a = 180, K = 500, e = 0.5 and h = 200. When the death rate is higher than the birth rate, the system dynamics drive the state (population size) to smaller values. When the birth rate is higher, the system moves right, as indicated by the arrows. (b) The potential energy is given by the negative integral of b(n)–d(n), shown in the lower plot. The potential function gives an intuitive picture of the stability of a system by imagining the curve as a surface on which a ball is free to bounce across wells correspond to stable points and peaks to unstable points. While most trajectories remain near the stable well, some transition out merely by chance. An example of such a trajectory is shown in the top panel, in which time increases along the vertical axis. Though initially oscillating around the stable state, a chance excursion carries it beyond the Allee threshold (vertical dotted line). Such chance trajectories can produce the statistical patterns as observed in true critical transitions seen in (c): early warning signals are aimed at detecting systems that are slowly moving towards a tipping point or bifurcation, illustrated in the successive curves (deteriorating and critical). Top panel: an example trajectory from a simulation under this process shows the state of the system as the potential moves towards the bifurcation point. The original position of the Allee threshold is shown by the vertical dotted line (though it moves slightly as the parameter changes).
Figure 2.
Figure 2.
The distribution of the correlation statistic τ for two early warning indicators (variance, autocorrelation) on replicates conditionally selected for having collapsed by chance in simulations is shown in grey bars. Solid lines indicate the estimated density of the statistic from a random sample of the simulations (not conditional on observing a transition). Positive values of τ correspond to a pattern of an indicator increasing with time; typically taken as evidence that a system is approaching a critical transition. In these simulations, the pattern arises instead from the prosecutor's fallacy of conditional selection.
Figure 3.
Figure 3.
The identical analysis from figure 2 is shown for the model in equation (2.3), using parameters r = 0.75, K = 10, a = 1.7, Q = 3 and H = 1. A similar statistical bias, particularly towards positive values of τ, occurs in this model as well.

References

    1. Sullivan, p320, in People v. Collins, 68 Cal. 2d 319 (1968)
    1. Thompson W. C., Schumann E. L. 1987. Interpretation of statistical evidence in criminal trials: the prosecutor's fallacy and the defense attorney's fallacy. Law Hum. Behav. 11, 167–18710.1007/BF01044641 (doi:10.1007/BF01044641) - DOI - DOI
    1. Carpenter J. 2011. May the best analyst win. Science 331, 698–69910.1126/science.331.6018.698 (doi:10.1126/science.331.6018.698) - DOI - DOI - PubMed
    1. Mumby P. J., Hastings A., Edwards H. J. 2007. Thresholds and the resilience of Caribbean coral reefs. Nature 450, 98–10110.1038/nature06252 (doi:10.1038/nature06252) - DOI - DOI - PubMed
    1. Kéfi S., Rietkerk M., Alados C. L., Pueyo Y., Papanastasis V. P., Elaich A., de Ruiter P. C. 2007. Spatial vegetation patterns and imminent desertification in Mediterranean arid ecosystems. Nature 449, 213–21710.1038/nature06111 (doi:10.1038/nature06111) - DOI - DOI - PubMed

Publication types