. 2012 Oct 10;32(41):14227-41.
doi: 10.1523/JNEUROSCI.6329-11.2012.

A new vesicular scaffolding complex mediates the G-protein-coupled 5-HT1A receptor targeting to neuronal dendrites

Affiliations

A new vesicular scaffolding complex mediates the G-protein-coupled 5-HT1A receptor targeting to neuronal dendrites

Sana Al Awabdh et al. J Neurosci. .

Abstract

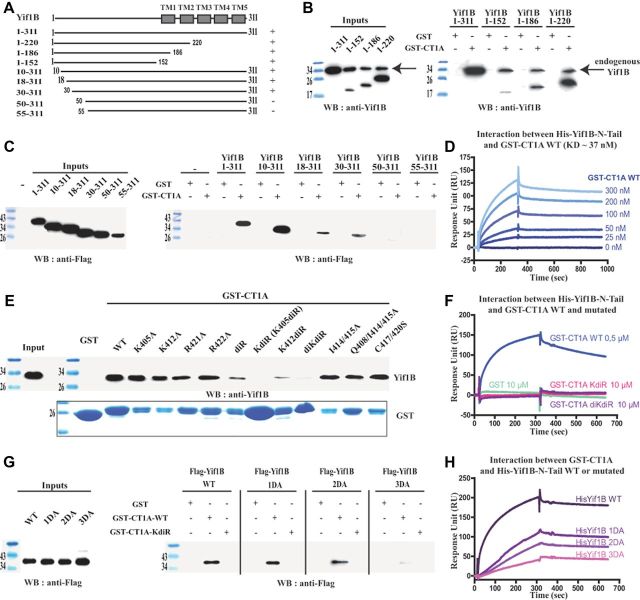
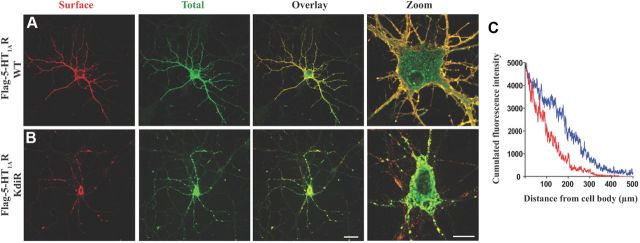
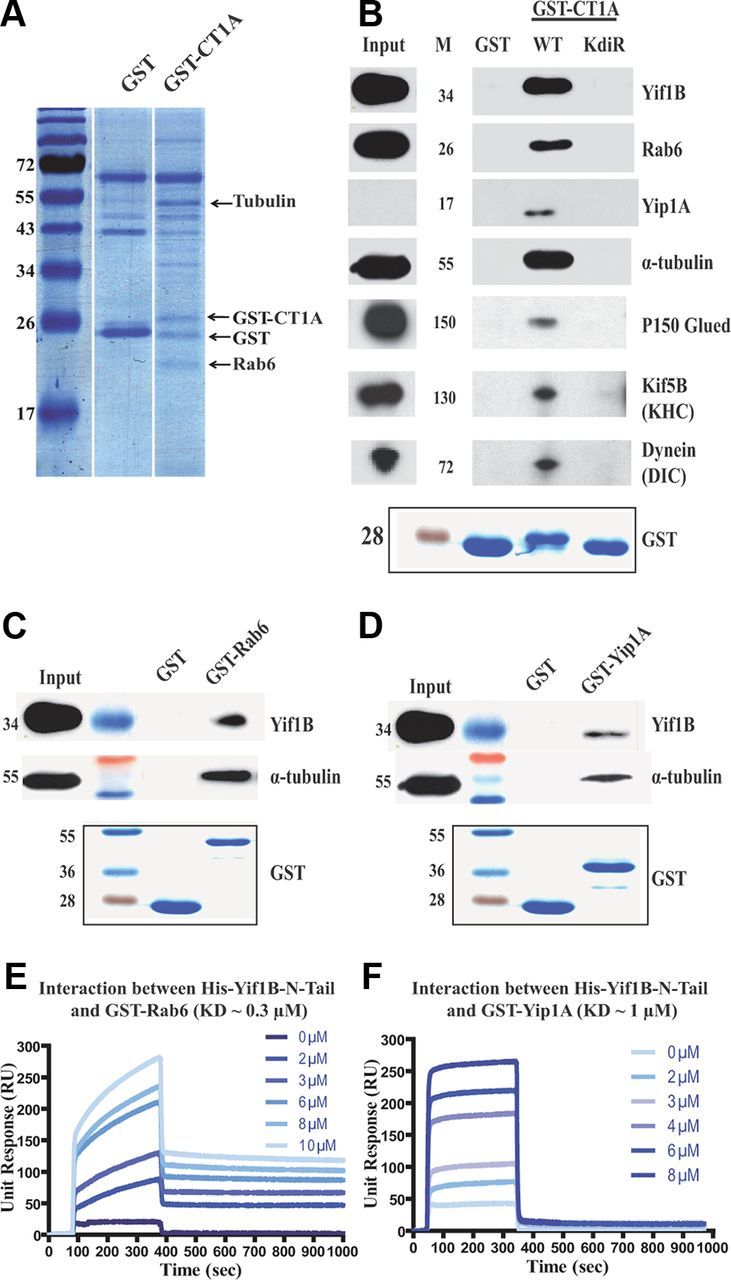
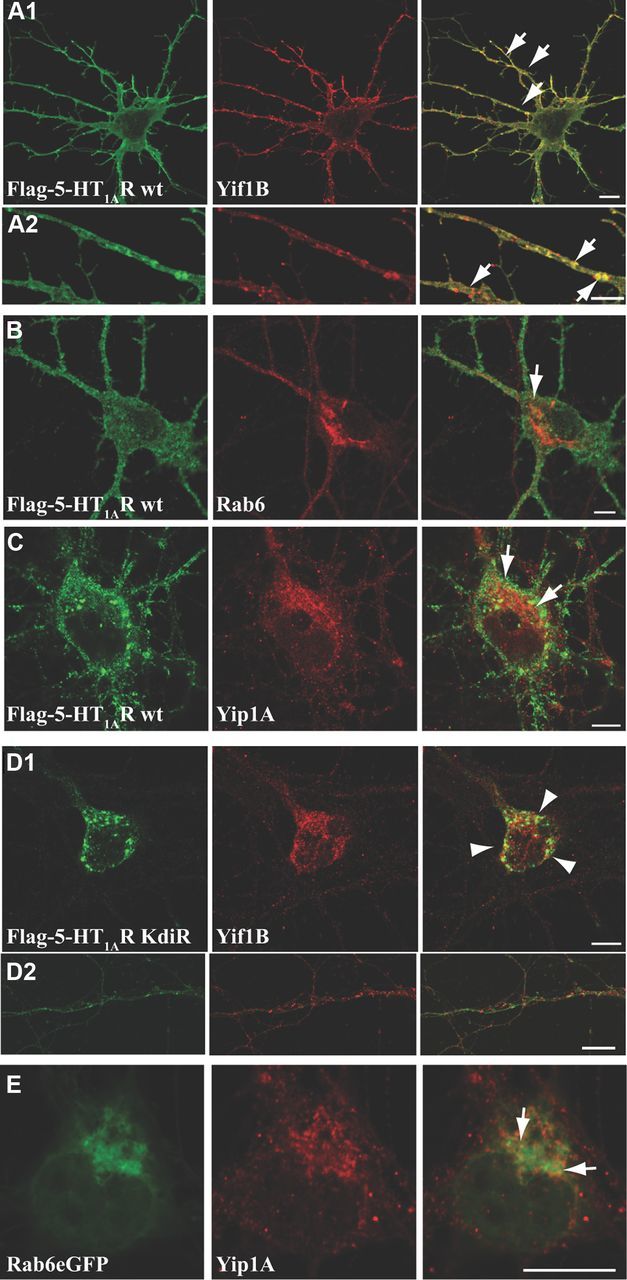
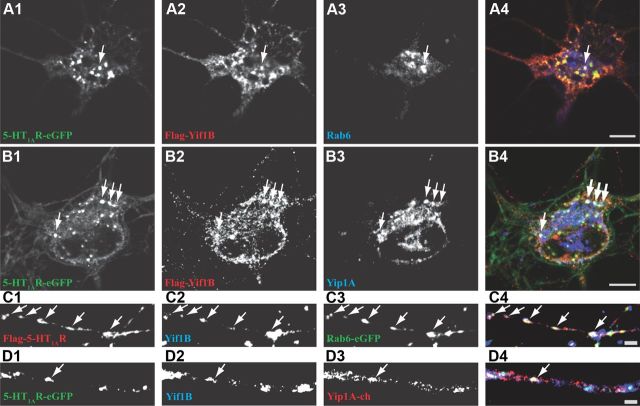
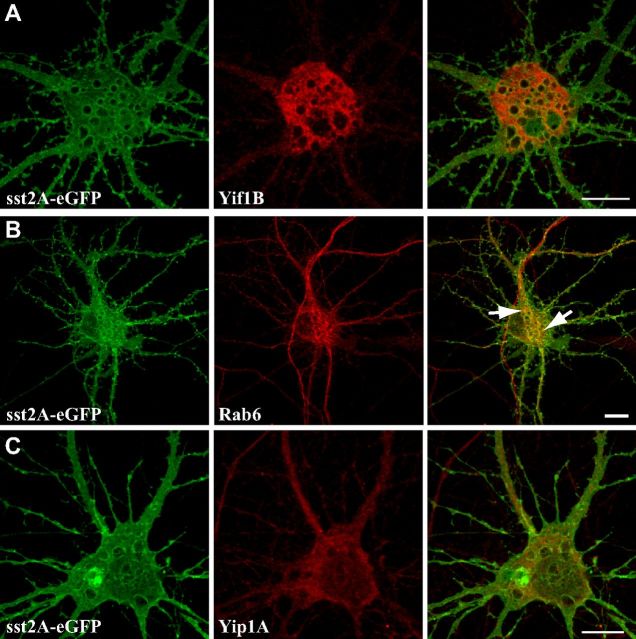
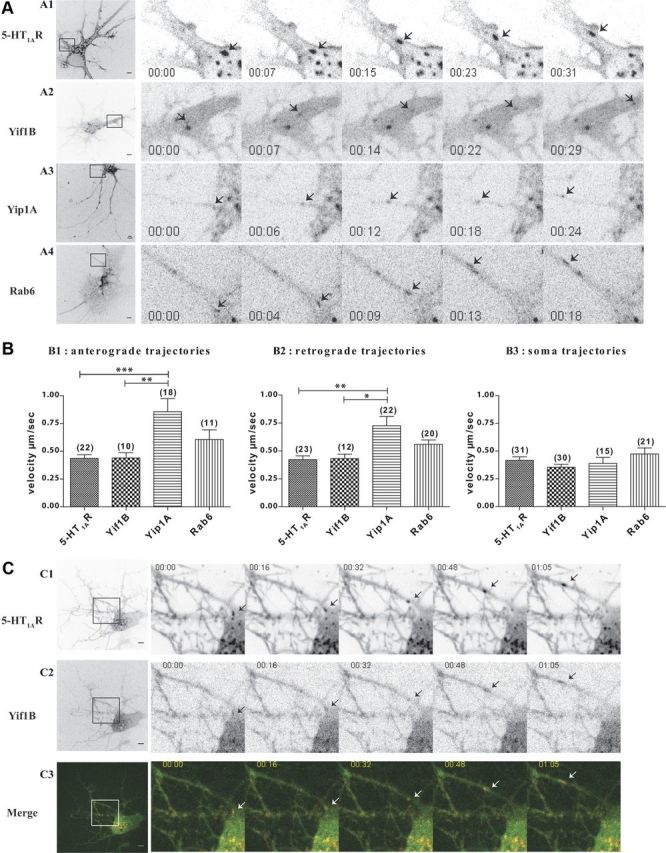
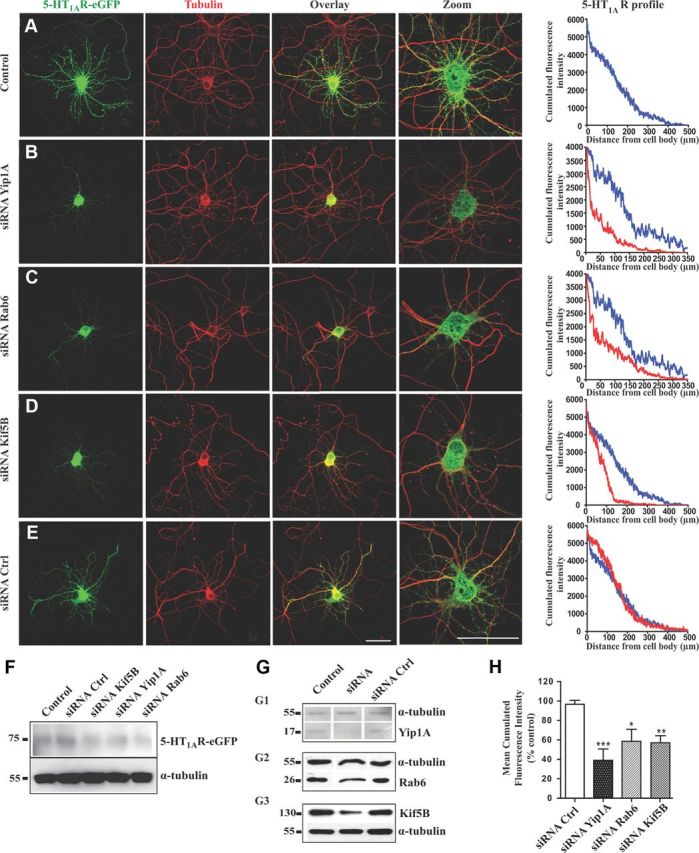
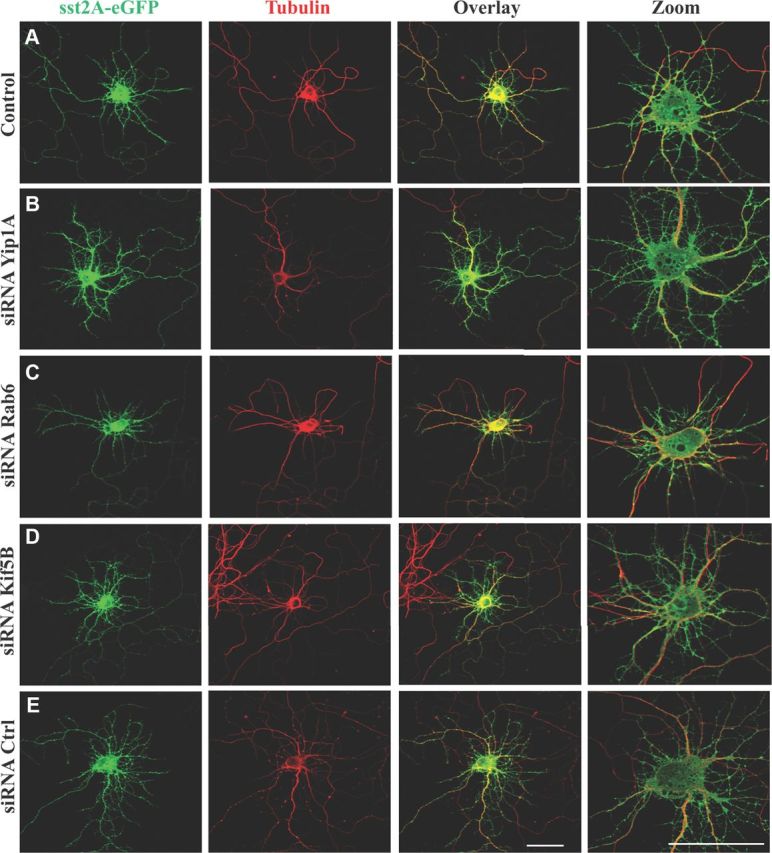
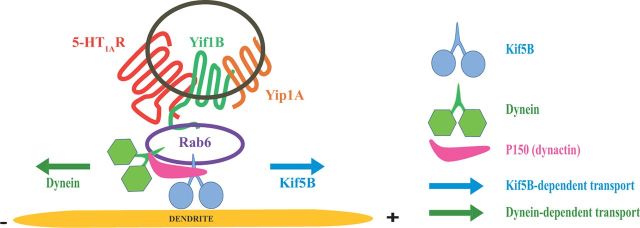
Although essential for their neuronal function, the molecular mechanisms underlying the dendritic targeting of serotonin G-protein-coupled receptors are poorly understood. Here, we characterized a Yif1B-dependent vesicular scaffolding complex mediating the intracellular traffic of the rat 5-HT(1A) receptor (5-HT(1A)R) toward dendrites. By combining directed mutagenesis, GST-pull down, and surface plasmon resonance, we identified a tribasic motif in the C-tail of the 5-HT(1A)R on which Yif1B binds directly with high affinity (K(D) ≈ 37 nM). Moreover, we identified Yip1A, Rab6, and Kif5B as new partners of the 5-HT(1A)R/Yif1B complex, and showed that their expression in neurons is also crucial for the dendritic targeting of the 5-HT(1A)R. Live videomicroscopy revealed that 5-HT(1A)R, Yif1B, Yip1A, and Rab6 traffic in vesicles exiting the soma toward the dendritic tree, and also exhibit bidirectional motions, sustaining their role in 5-HT(1A)R dendritic targeting. Hence, we propose a new trafficking pathway model in which Yif1B is the scaffold protein recruiting the 5-HT(1A)R in a complex including Yip1A and Rab6, with Kif5B and dynein as two opposite molecular motors coordinating the traffic of vesicles along dendritic microtubules. This targeting pathway opens new insights for G-protein-coupled receptors trafficking in neurons.


Conflict of interest statement

The authors declare no financial conflicts of interest.

Figures

Figure 1.
Figure 1.
Characteristics of the 5-HT1AR/Yif1B interaction. A, Schematic representation of the different Yif1B constructs used in this study. Boxes represent the transmembrane domains (TMs). Interaction with the C-tail of the 5-HT1AR is indicated (±). B, C, Purified WT GST-CT1A or GST alone (control) was incubated with HEK cell lysates expressing the different truncated Yif1B forms (Inputs, left panels). D, Surface plasmon resonance (SPR) determination of the association and dissociation constants for the interaction between WT GST-CT1A and WT His-Yif1B. The concentration range of GST-CT1A was 0–300 nm in six serial concentrations passed on His-Yif1B immobilized on a sensor chip (n = 3). Data are presented as real-time graphs of response unit (RU) against time and were analyzed using a 1:1 Langmuir binding model to determine the KD value reported in Table 1. E, G, Purified GST-CT1A (WT, KdiR, and other mutants) and GST alone (negative control) were incubated with rat brain lysates (E), or HeLa cell lysates expressing the different Flag-tagged mutated Yif1B (G). GST proteins were visualized using Coomassie Blue (E, bottom). Inputs represent a 2.5% load of the total lysates used in all conditions. GST pull-downs were analyzed by Western blot followed by ECL+ detection (right panels) using anti-Yif1B antibody (B, E) or anti-Flag antibody (C, G). F, H, SPR analyses of the binding of various mutated and WT forms of His-Yif1B with WT or mutated GST-CT1A. WT His-Yif1B (F) and mutated His-Yif1B (H) were each immobilized on a sensor chip. Binding assays with 500 nm WT GST-CT1A, 10 μm mutated GST-CT1A mutants KdiR or diKdiR (F), and 10 μm GST alone (F, H) used as a negative control were passed over the chip (n = 3). Data are presented as real-time graphs of RU against time.
Figure 2.
Figure 2.
The KdiR mutation disturbs the targeting of the 5-HT1AR. A, B, Expression of the Flag-5-HT1AR WT (A) and the Flag-5-HT1A KdiR mutant (B) 48 h after transfection of hippocampal neurons. Comparison of surface staining with mouse monoclonal anti-Flag antibody (red) and total labeling with the rabbit anti-Flag (green) after plasma membrane permeabilization. Scale bars: (in B) Overlay, 50 μm; Zoom, 10 μm. C, The profile of the cumulated fluorescence intensity of the receptor (cumulated F.I., arbitrary unit) along the longest dendrite (μm), in blue for the Flag-5-HT1AR WT, and in red for the KdiR mutant (surface, total, overlay). The mean cumulated fluorescence intensity along the 50–100 μm length from the soma shows a significant difference between the WT (mean F.I = 149.7 ± 11.8, n = 24) and the mutated 5-HT1AR (mean F.I. = 11.8 ± 8.8, n = 24) (unpaired t test, F(1,46) = 3.217, p = 0.0024).
Figure 3.
Figure 3.
Rab6, Yip1A, tubulin, P150, Kif5B, and dynein interact with the 5-HT1AR via Yif1B. A, GST pull-down experiments with the WT GST-CT1A and GST alone as a control on rat brain extracts separated by a one-dimensional 12% SDS-PAGE stained by Colloidal Blue before identification by mass spectrometry. B–D, GST pull-down experiments performed on rat brain lysates with purified WT (B) or KdiR GST-CT1A (C) purified GST-Rab6 or GST-Yip1A N-tail (D) and GST alone (negative control). GST pull-downs were analyzed by Western blot followed by ECL+ detection, and illustrations result from experiments loaded on the same gel. GST proteins were visualized using Coomassie Blue (bottom panels). Inputs represent a 2.5% load of the total lysates used in all conditions. Western blots (top panels) were revealed using anti-Yif1B (B–D), anti-Rab6 (B), anti-Yip1A (B), anti α-tubulin (B–D) antibodies, anti-P150 Glued (B), anti-Kif5B heavy chain (B), and anti-dynein intermediate chain (B). E, F, Kinetic studies of the interaction between GST-Rab6 (E) or the N-tail of GST-Yip1A (F) and WT His-Yif1B determined by surface plasmon resonance. The concentration range was 0–10 μm for GST-Rab6 (E) and 0–8 μm for the N-tail of GST-Yip1A (F) in six serial dilutions passed over His-Yif1B immobilized on a sensor chip (n = 2). Data are presented as real-time graphs of response unit (RU) against time and were analyzed using a 1:1 Langmuir binding model.
Figure 4.
Figure 4.
Colocalization between WT or mutated 5-HT1AR and endogenous Yif1B, Yip1A, and Rab6 in neurons. A–D, Hippocampal neurons were transfected at DIV7 with the Flag-5-HT1AR wt (A–C) or the Flag-5-HT1AR KdiR mutant (D) and labeled 48 h post-transfection for endogenous Yif1B (A1, A2, D1, D2), Rab6 (B), or Yip1A (C) in red. E, Colocalization of Rab6-eGFP and endogenous Yip1A. Some punctate colocalizations are shown by arrows in overlay; arrowheads show large intracellular clusters of the Flag-5-HT1AR KdiR. Scale bars, 10 μm.
Figure 5.
Figure 5.
The 5-HT1AR/Yif1B complex colocalizes with Rab6 and Yip1A in somatic and dendritic vesicles. A, B, D, Hippocampal neurons were cotransfected at DIV 7 with the 5-HT1AR-eGFP receptor (A1, B1, D1) and Flag-Yif1B (A2, B2) and labeled 48 h post-transfection with the anti-Flag antibody in red (A2, B2) and for endogenous Rab6 (A3) or Yip1A (B3) in blue. The Flag-5-HT1AR was labeled with anti-Flag antibody in red (C1), Rab6-eGFP (C3) shown in green and endogenous Yif1B labeled with anti-Yif1B in blue (C2, D2), or with Yip1A-Cherry in red (D3). Some punctate colocalizations are shown by arrows. A4–D4, Overlay. Scale bars, 10 μm.
Figure 6.
Figure 6.
Colocalization between Yif1B, Yip1A, or Rab6 and the sst2A-eGFP receptor. A–C, Hippocampal neurons were transfected at DIV7 with the sst2A-eGFP (A–C) and labeled 48 h post-transfection for the endogenous Yif1B (A) Rab6 (B), or Yip1A (C) in red. Some punctate colocalizations are shown by arrows in overlay with Rab6 (B). Scale bars, 10 μm.
Figure 7.
Figure 7.
The 5-HT1AR and its partners traffic in mobile vesicles exiting from the soma toward dendrites. A, Inverted monochrome images from time-lapse imaging of hippocampal neurons expressing the 5-HT1AR-cherry (A1), Yif1B-eGFP (A2), Rab6-eGFP (A3), and Yip1A-cherry (A4). Left panels show the whole field, with a boxed area corresponding to the zoom on proximal dendrites. Arrows follow the labeled vesicles during their anterograde dendritic transport. Scale bars, 5 μm. B, Mean velocities of moving vesicles. Trajectories of moving vesicles were tracked with the MTrackJ Plugin of ImageJ software. Trajectories were classified as anterograde (B1) or retrograde (B2) according to their direction in dendrites or as somatic (B3) if the traffic occurred only in the soma. Bar graphs show mean + SEM, calculated and plotted using GraphPad 4 Software. Numbers of trajectories are indicated in parentheses above bar graphs. ***p < 0.0001, **p < 0.001, *p < 0.05 (one-way ANOVA with Bonferroni's post hoc test). C, Time-lapse imaging 2 d after the transfection of hippocampal neurons with the 5-HT1AR-cherry and Yif1B-eGFP. Inverted monochrome images of the 5-HT1AR (C1) and Yif1B-eGFP (C2). Double-labeled migrating puncta are visualized in the overlay (C3). Left panels show the whole field, with a boxed area corresponding to the zoom on proximal dendrites. Arrows point at the particles during their anterograde dendritic transport. Scale bars, 5 μm.
Figure 8.
Figure 8.
Yip1A, Rab6, or Kif5B depletions disturb 5-HT1AR targeting toward distal dendrites. A–E, Immunofluorescence of neurons transfected with the 5-HT1AR-eGFP alone (A) or cotransfected with the 5-HT1AR-eGFP plus siRNAs against endogenous Yip1A (B), endogenous Rab6 (C), endogenous Kif5B (D), or control siRNA (E). Immunolabeling was performed with anti-GFP antibody to enhance the GFP signal (green, left) or anti-α-tubulin antibody (red, middle). Overlay and zoom on the soma are shown on the right. On the right panels, the graphs represents the cumulated fluorescence intensities of the 5-HT1AR (cumulated fluorescence intensity, arbitrary unit) along the longest dendrite of monitored neurons (μm), in control conditions (blue) compared with experimental conditions (red) with siRNA against Yip1A, Rab6 or Kif5B. Scale bars, 50 μm. F, Expression level of the 5-HT1AR-eGFP was similar in siRNA-transfected neurons in comparison with control conditions after visualization on Western blot of protein extracts 48 h after transfection of neurons at DIV7. G, Downregulation of the Yip1A, Rab6, and Kif5B proteins by siRNAs in primary cultures of rat hippocampal neurons 48 h after transfection of neurons at DIV7. Yip1A (G1), Rab6 (G2), and Kif5B (G3) were detected by Western blots of protein extracts; α-tubulin was immunolabeled in the same membrane to normalize the amount of extract. All neurons were cotransfected with 5-HT1AR-eGFP alone (Control) or with 5-HT1AR-eGFP plus siRNA directed against endogenous Yip1A, Rab6, or Kif5B, or control siRNA. H, Normalized average 5-HT1AR fluorescence in dendrites along 50–100 μm from soma. Mean fluorescence at 50 μm was calculated for 20 neurons for each condition and then normalized to the mean value of the control condition [siRNA(control), siRNA(Yip1A), siRNA(Rab6), and siRNA(Kif5B)]. The fluorescence of 5-HT1AR is significantly lower in dendrites after siRNA-induced downregulation of Kif5B, Rab6, or Yip1A. N = 20–30 neurons per condition. Bar graphs show mean + SEM. *p < 0.05, **p < 0.01 ***p < 0.001 (one-way ANOVA with Dunnett's multiple comparison post hoc test).
Figure 9.
Figure 9.
Effect of Yip1A, Rab6, and Kif5B depletions on sst2A-eGFP targeting toward distal dendrites. A–E, Immunofluorescence of neurons transfected with the sst2A-eGFP alone (A) or cotransfected with the sst2A-eGFP plus siRNAs against endogenous Yip1A (B), endogenous Rab6 (C), endogenous Kif5B (D), or control siRNA (E). Immunofluorescence was performed with an anti-GFP antibody to enhance the GFP signal (green, left) or an anti-α-tubulin antibody (red, middle). Right, Overlay and zoom on the soma. Scale bars, 50 μm.
Figure 10.
Figure 10.
Schematic representation of the Yif1B scaffolding complex involved in 5-HT1AR trafficking toward dendrites. According to the model built from the data reported herein, the Yif1B-dependent transport would involve Yif1B as the scaffold protein assembling the 5-HT1AR, Yip1A, and Rab6 in the same vesicles trafficking along the dendritic microtubules, using two opposite molecular motors, the conventional kinesin Kif5B and the dynein for their bidirectional movements. The dynactin subunit P150 would enable switching between molecular motors for the bidirectional transport observed in the dendrites. Rab6 might play the role of an intermediate protein for the interaction of these molecular motors with the Yif1B scaffolding complex.

References

    1. Albert PR, Zhou QY, Van Tol HH, Bunzow JR, Civelli O. Cloning, functional expression, and mRNA tissue distribution of the rat 5-hydroxytryptamine1A receptor gene. J Biol Chem. 1990;265:5825–5832. - PubMed
    1. Barrowman J, Wang W, Zhang Y, Ferro-Novick S. The Yip1p.Yif1p complex is required for the fusion competence of endoplasmic reticulum-derived vesicles. J Biol Chem. 2003;278:19878–19884. - PubMed
    1. Björk K, Sjögren B, Svenningsson P. Regulation of serotonin receptor function in the nervous system by lipid rafts and adaptor proteins. Exp Cell Res. 2010;316:1351–1356. - PubMed
    1. Bockaert J, Perroy J, Bécamel C, Marin P, Fagni L. GPCR interacting proteins (GIPs) in the nervous system: roles in physiology and pathologies. Annu Rev Pharmacol Toxicol. 2010;50:89–109. - PubMed
    1. Bortolozzi A, Castañé A, Semakova J, Santana N, Alvarado G, Cortés R, Ferrés-Coy A, Fernández G, Carmona MC, Toth M, Perales JC, Montefeltro A, Artigas F. Selective siRNA-mediated suppression of 5-HT(1A) autoreceptors evokes strong anti-depressant-like effects. Mol Psychiatry. 2012;17:612–623. - PubMed

Publication types

MeSH terms

Substances