. 2012 Nov 30;287(49):40982-95.
doi: 10.1074/jbc.M112.414805. Epub 2012 Oct 10.

Identification of location and kinetically defined mechanism of cofactors and reporter genes in the cascade of steroid-regulated transactivation

Affiliations

Identification of location and kinetically defined mechanism of cofactors and reporter genes in the cascade of steroid-regulated transactivation

John A Blackford Jr et al. J Biol Chem. .

Abstract

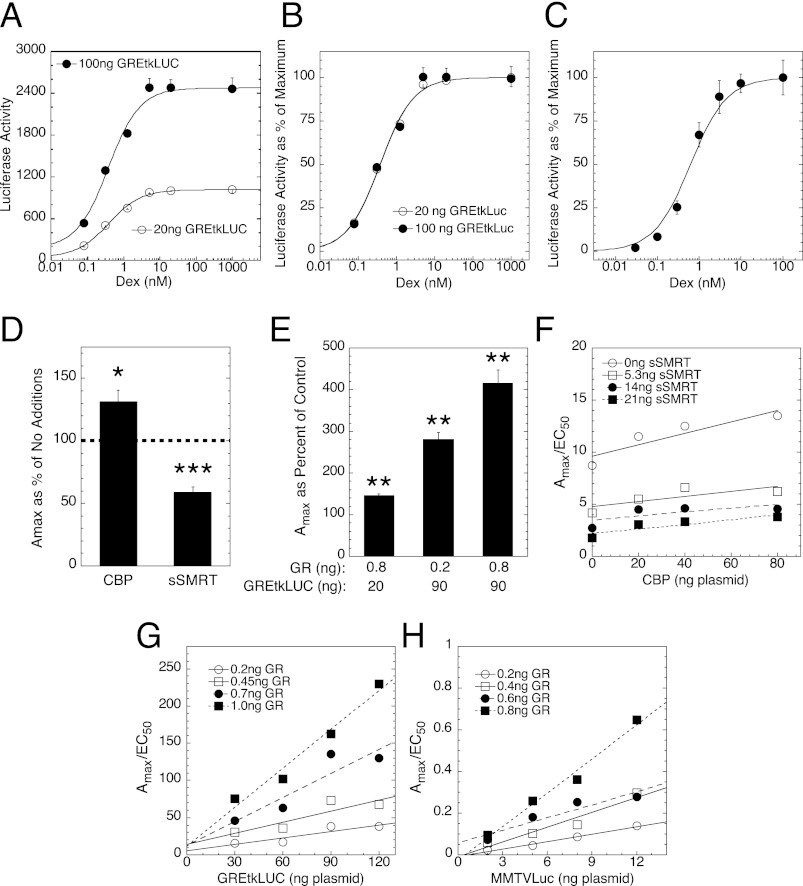
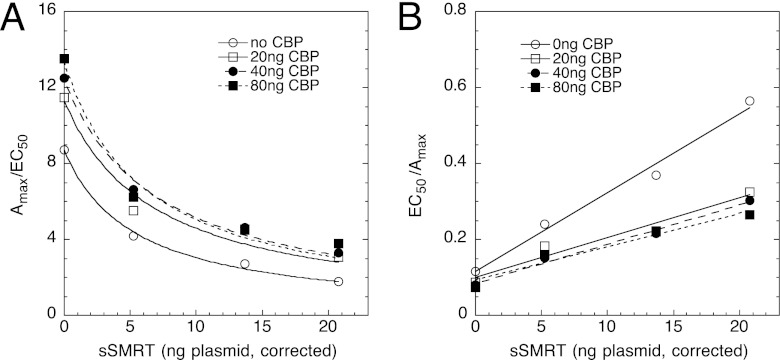
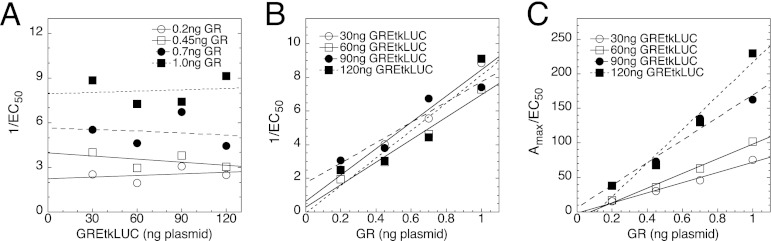
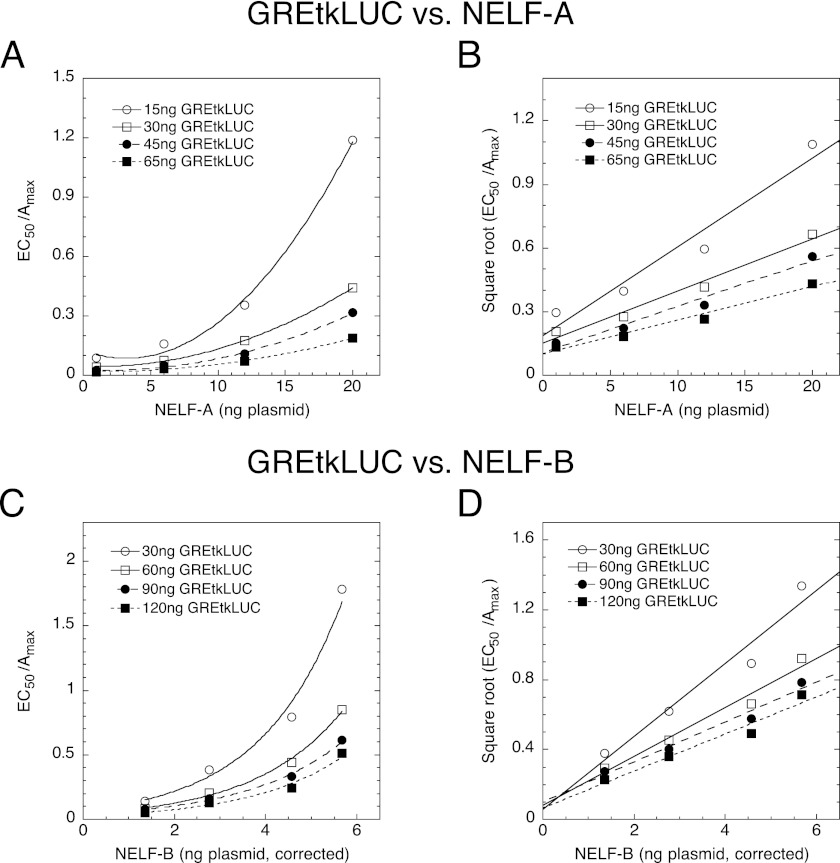
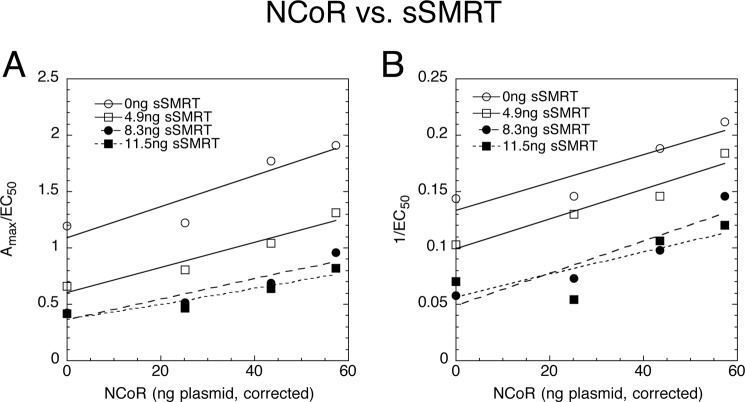
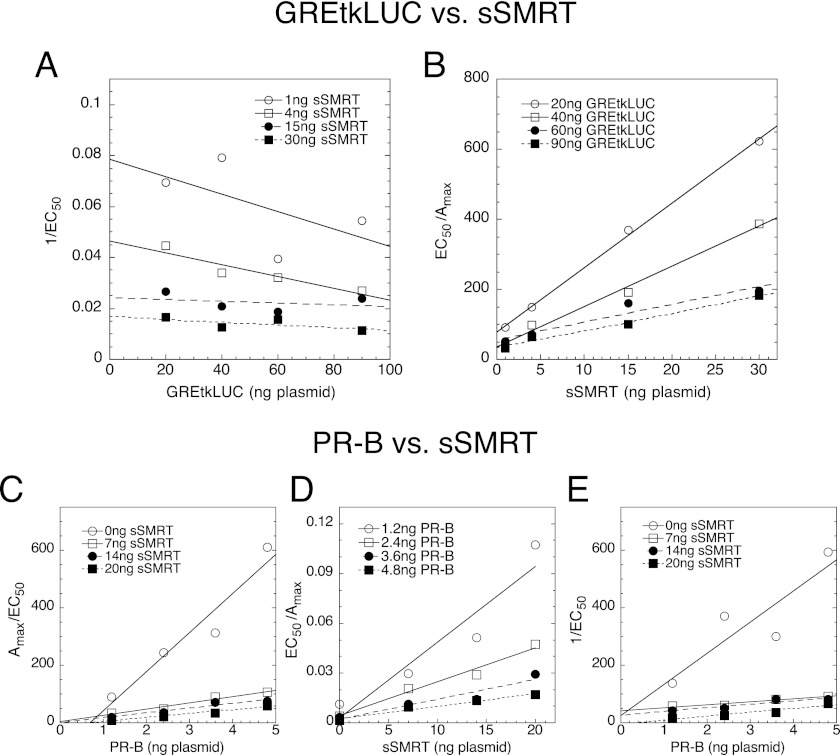
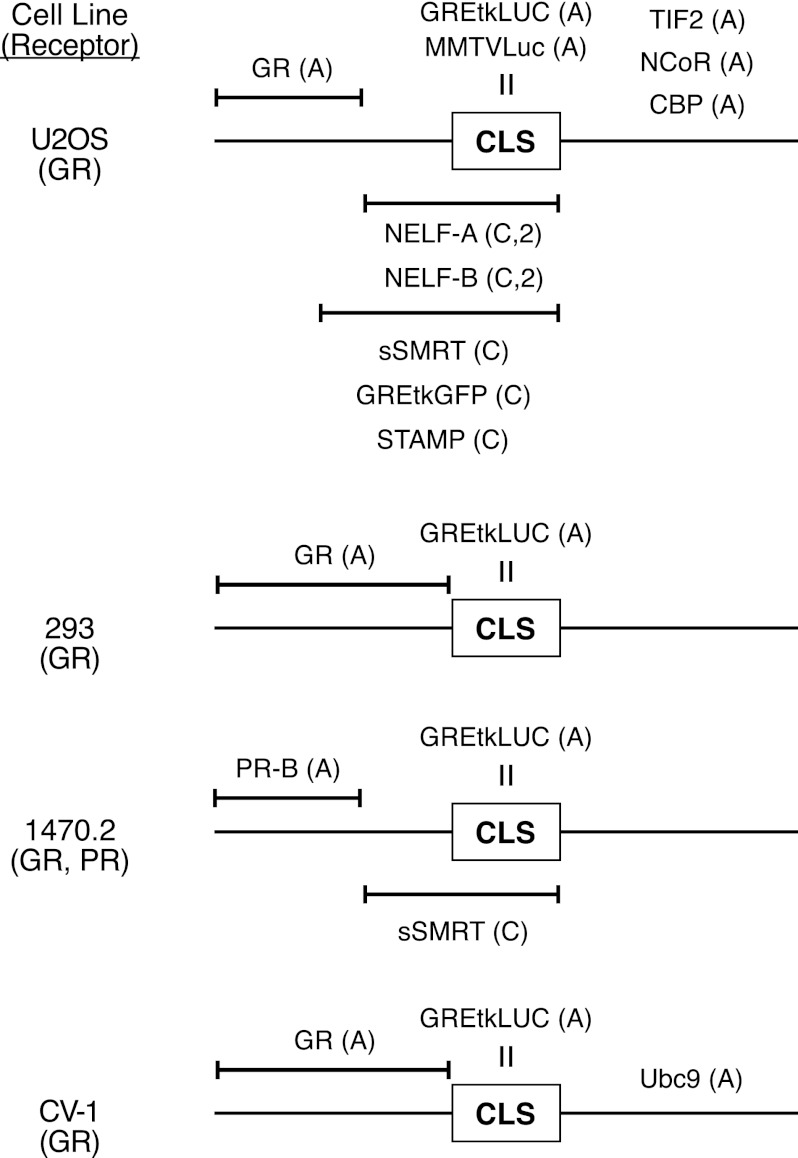
A currently obscure area of steroid hormone action is where the component factors, including receptor and reporter gene, act. The DNA binding of factors can be precisely defined, but the location and timing of factor binding and action are usually not equivalent. These questions are addressed for several factors (e.g. glucocorticoid receptor (GR), reporter, TIF2, NCoR, NELF-A, sSMRT, and STAMP) using our recently developed competition assay. This assay reveals both the kinetically defined mechanism of factor action and where the above factors act relative to both each other and the equilibrium equivalent to the rate-limiting step, which we call the concentration limiting step (CLS). The utility of this competition assay would be greatly increased if the position of the CLS is invariant and if the factor acting at the CLS is known. Here we report that the exogenous GREtkLUC reporter acts at the CLS as an accelerator for gene induction by GRs in U2OS cells. This mechanism of reporter function at the CLS persists with different reporters, factors, receptors, and cell types. We, therefore, propose that the reporter gene always acts at the CLS during gene induction and constitutes a landmark around which one can order the actions of all other factors. Current data suggest that how and where GR and the short form of SMRT act is also constant. These results validate a novel and rational methodology for identifying distally acting factors that would be attractive targets for pharmaceutical intervention in the treatment of diseases involving GR-regulated genes.


Figures

FIGURE 1.
FIGURE 1.
Characteristics of the competition assay in U2OS cells. A and B, dose-response curves for GR induction of exogenous GREtkLUC reporter give first-order Hill plots of different amplitudes. GR (0.5 ng of plasmid) induction of two amounts of transiently transfected GREtkLUC plasmid with different concentrations of Dex was conducted, and the results of a single representative experiment were then plotted, as described under “Experimental Procedures.” The effect of varying reporter on the Amax is displayed in A, whereas the influence of reporter concentration on the EC50 is given in B. C, a dose-response curve for GR induction of exogenous MMTVLuc reporter is first order. U2OS cells were transiently transfected with GR (0.8 ng) and MMTVLuc (100 ng) and treated with Dex, and the results of a single representative experiment are plotted as in B. D, CBP increases, and sSMRT decreases GR induction of GREtkLUC. U2OS cells were transiently transfected with GR (0.5 ng) and GREtkLUC (100 ng) plus 80 ng of CBP plasmid or 40 ng of sSMRT and induced by three subsaturating concentrations of Dex. In all instances an empty vector(s) was added to maintain a constant molar equivalent of the vector for the sSMRT and CBP plasmids. Luciferase activity was determined, and the Amax at saturating Dex concentrations was determined by exact curve fitting as described under “Experimental Procedures.” The Amax with CBP and sSMRT was expressed as percent of that for cells with no added factor, and the average value (± S.E.) from six independent experiments was plotted. The dashed line indicates no change relative to cells with no addition. *, p < 0.02; ***, p < 0.0003 compared with no addition. E, the ability of GR and GREtkLUC to increase Amax is additive. Cells were transfected with 0.2 ng of GR and 20 ng of GREtkLUC plasmids (control cells) or the indicated amounts of GR and GREtkLUC and induced with subsaturating Dex concentrations before graphically determining the Amax for induced luciferase at saturating Dex as described in panel D. The Amax for each composition of GR and GREtkLUC was expressed as percent of control cells. The average values (±S.E.) from four independent experiments were then plotted. **, p ≤ 0.002 compared with control cells. F–H, different graphical properties of the common plot of Amax/EC50 versus factor are shown. All combinations of four concentrations each of CBP and sSMRT plasmid (plus 5 ng of GR and 100 ng of GREtkLUC) or the indicated amounts of GR and GREtkLUC or MMTVLuc for a total of 16 sets were used to cotransfect U2OS cells, which were then treated with three subsaturating concentrations of Dex before determining the amounts of induced luciferase. Exact fits of these data to a first-order Hill plot yielded the Amax and EC50 for each combination as described under “Experimental Procedures.” Graphs of Amax/EC50 versus CBP (F), versus GREtkLUC (G), and versus MMTVLuc (H) at different concentrations of the other factor were constructed and analyzed as detailed under “Results.” Graphs shown are for a single representative experiment (total = 3–5).
FIGURE 2.
FIGURE 2.
Competition assay for CBP and sSMRT during GR-mediated induction in U2OS cells. Assays were conducted as described for Fig. 1F. Graphs of Amax/EC50 versus sSMRT (A), and EC50/Amax versus sSMRT (B) at different concentrations of the other factor, CBP, were constructed and analyzed as detailed under “Results.” Graphs shown are for a single representative experiment (total = 5).
FIGURE 3.
FIGURE 3.
Competition assay with GR and GREtkLUC during GR-mediated induction in U2OS cells. Assays were conducted as described for Fig. 1F. Graphs of 1/EC50 versus GREtkLUC (A), 1/EC50 versus GR (B), and Amax/EC50 versus GREtkLUC (C) at different concentrations of the other factor were constructed and analyzed as detailed under “Results.” Graphs shown are for a single representative experiment (total = 4).
FIGURE 4.
FIGURE 4.
Competition of NELFs with GREtkLUC during GR-mediated induction in U2OS cells. Competition assays were conducted and analyzed as in Fig. 1 with the indicated amounts of GREtkLUC and competing factor plasmids plus 1 ng of GR plasmid. A and B, shown are plots of EC50/Amax and the square root of EC50/Amax versus NELF-A, respectively, in competition of GREtkLUC versus NELF-A. C and D, shown plots of EC50/Amax and the square root of EC50/Amax versus NELF-B, respectively, in competition of GREtkLUC versus NELF-B. Graphs shown are for a single representative experiment (total = 5 for both NELF-A and -B).
FIGURE 5.
FIGURE 5.
Competition of sSMRT and NCoR during GR-mediated induction of GREtkLUC in U2OS cells. Competition assays were conducted and analyzed as in Fig. 1 with the indicated amounts of sSMRT and NCoR plasmids plus 0.2 ng of GR and 100 ng of GREtkLUC plasmids. A and B, shown are plots of Amax/EC50 versus NCoR and 1/EC50 versus NCoR, respectively, in competition of NCoR versus sSMRT. Graphs shown are for a single representative experiment (total = 3).
FIGURE 6.
FIGURE 6.
Factor competition during PR-mediated induction of GREtkLUC in 1470.2 cells. Competition assays were conducted and analyzed as in Fig. 1 with the indicated amounts of plasmids. In these experiments, however, the transfected receptor was PR-B, and the inducing steroid was the synthetic progestin R5020. A and B, GREtkLUC versus sSMRT competition in the presence of 4 ng PR plasmid is shown. Plots are of 1/EC50 versus GREtkLUC and EC50/Amax versus sSMRT. C–E, shown is PR-B versus sSMRT competition in the presence of 100 ng of GREtkLUC. Plots are of Amax/EC50 versus PR-B, EC50/Amax versus sSMRT, and 1/EC50 versus PR-B, respectively. Graphs shown are for a single representative experiment (total = 4 for both GREtkLUC versus sSMRT and PR-B versus sSMRT).
FIGURE 7.
FIGURE 7.
Summary of how and where different factors and receptors act during induction of exogenous reporter genes in assorted cell lines. For each cell line, the receptor for which there are data is given in parentheses below the cell name. The horizontal line with the CLS box in the middle represents the unidentified sequence of steps in gene induction that are at the CLS, before the CLS (i.e. to the left of the CLS), or after the CLS (i.e. to the right of the CLS). The range of steps at which each factor has been found to act in the present study relative to the CLS is indicated by the horizontal error bar or by a vertical equal symbol when the precise position is known. For each factor, how the factor acts (accelerator = A, competitive decelerator = C) is given in parentheses after the factor name, with the number 2 designating that competition occurs at two separate steps. The results with TIF2 and Ubc9 are from earlier reports (6, 8). See “Discussion” for additional details.

References

    1. Rosenfeld M. G., Glass C. K. (2001) Coregulator codes of transcriptional regulation by nuclear receptors. J. Biol. Chem. 276, 36865–36868 - PubMed
    1. Nagy L., Schwabe J. W. (2004) Mechanism of the nuclear receptor molecular switch. Trends Biochem. Sci. 29, 317–324 - PubMed
    1. Métivier R., Reid G., Gannon F. (2006) Transcription in four dimensions. Nuclear receptor-directed initiation of gene expression. EMBO Rep. 7, 161–167 - PMC - PubMed
    1. Rosenfeld M. G., Lunyak V. V., Glass C. K. (2006) Sensors and signals. A coactivator/corepressor/epigenetic code for integrating signal-dependent programs of transcriptional response. Genes Dev. 20, 1405–1428 - PubMed
    1. Johnson A. B., O'Malley B. W. (2012) Steroid receptor coactivators 1, 2, and 3. Critical regulators of nuclear receptor activity and steroid receptor modulator (SRM)-based cancer therapy. Mol. Cell. Endocrinol. 348, 430–439 - PMC - PubMed

Publication types

LinkOut - more resources