. 2012;10(9):e1001393.
doi: 10.1371/journal.pbio.1001393. Epub 2012 Sep 25.

Multi-scale in vivo systems analysis reveals the influence of immune cells on TNF-α-induced apoptosis in the intestinal epithelium

Affiliations

Multi-scale in vivo systems analysis reveals the influence of immune cells on TNF-α-induced apoptosis in the intestinal epithelium

Ken S Lau et al. PLoS Biol. 2012.

Abstract

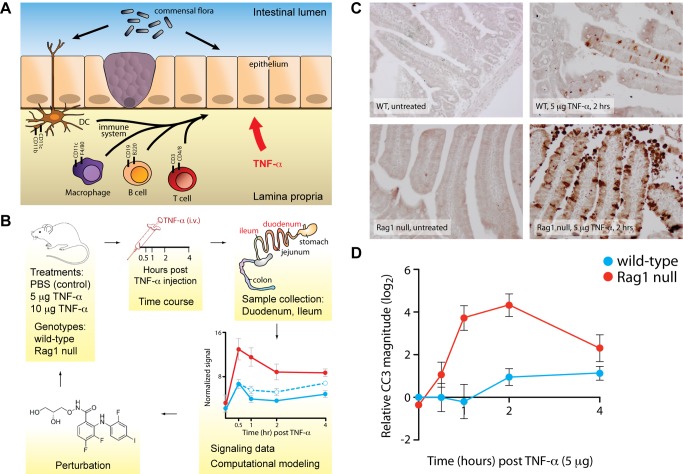
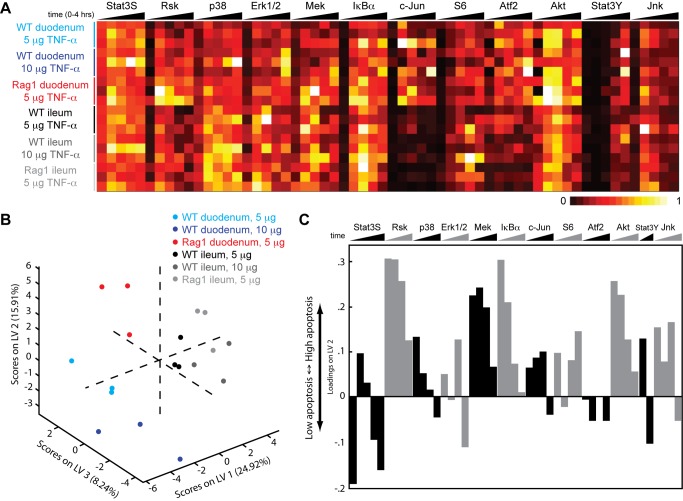
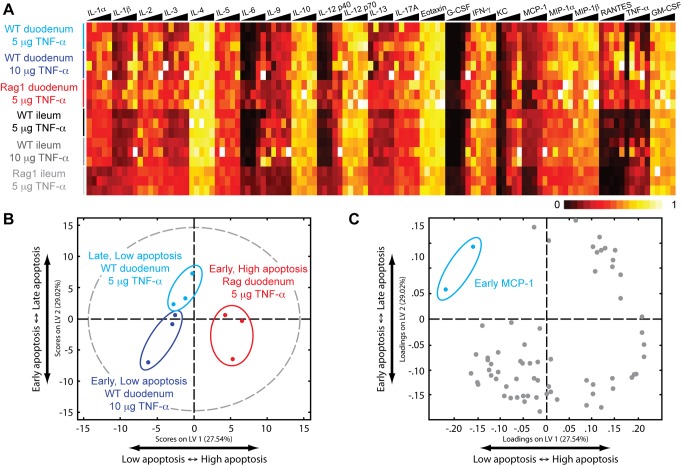
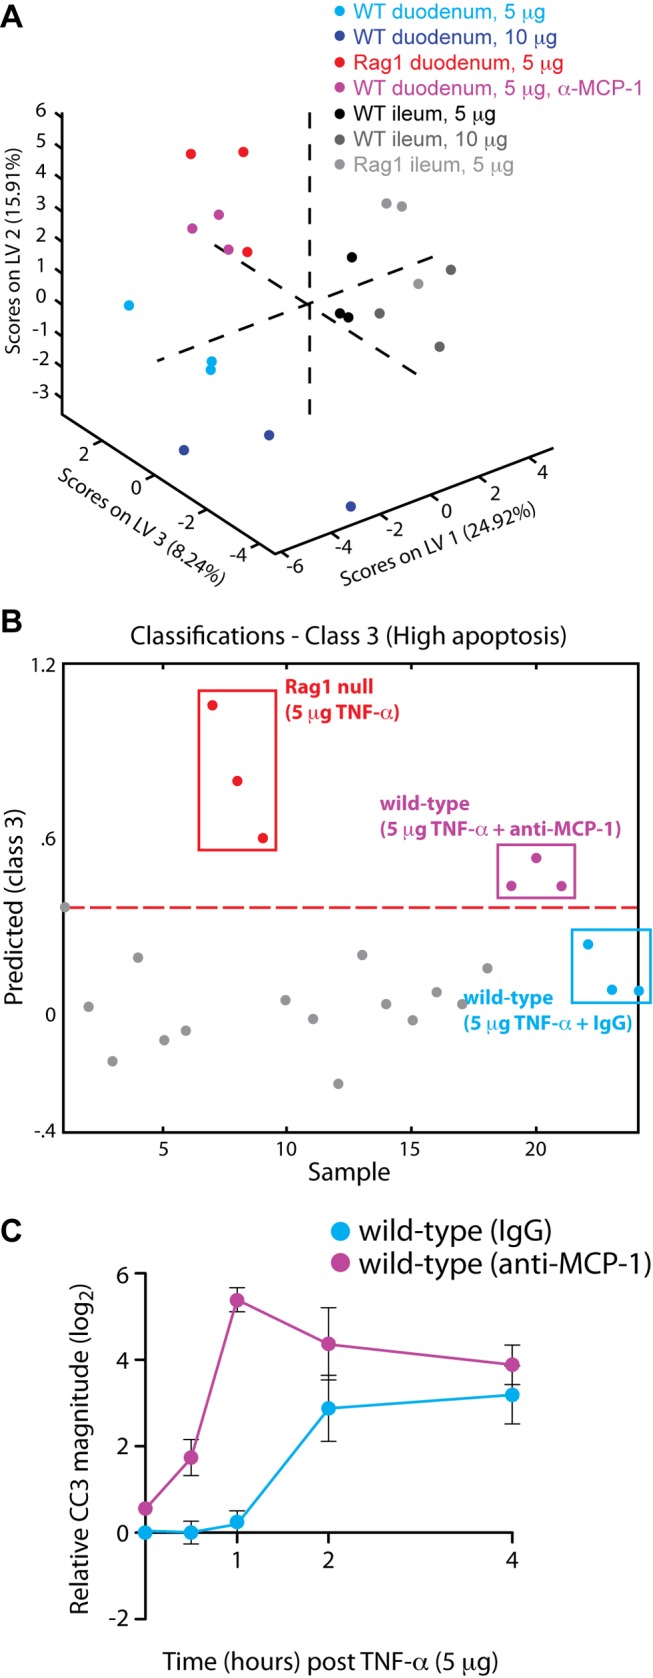
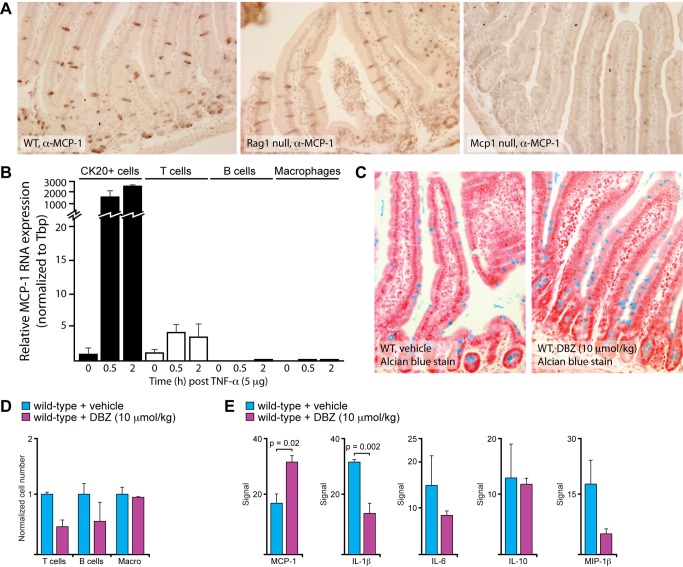
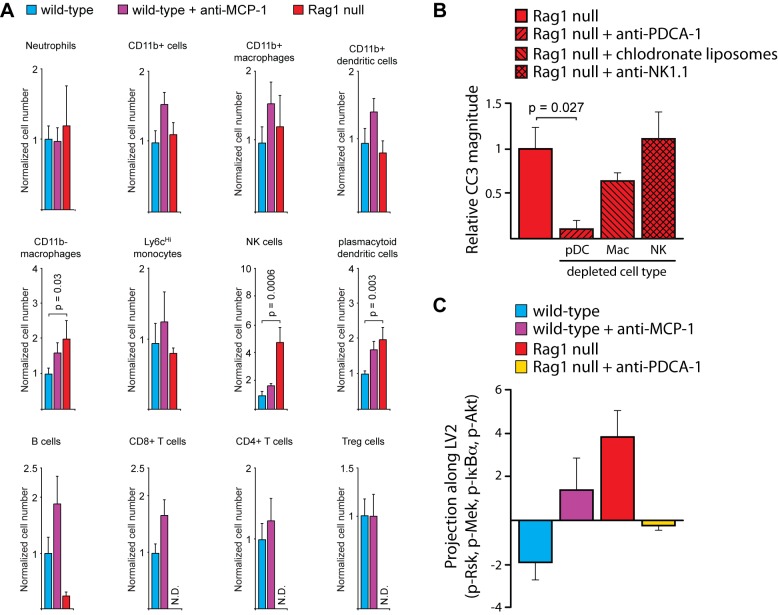
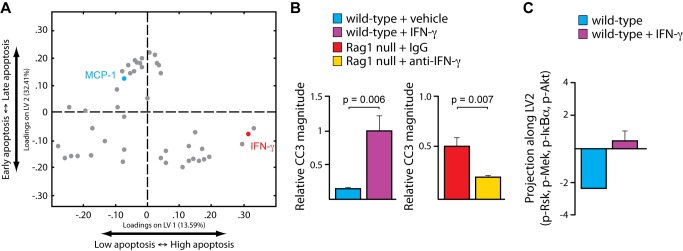
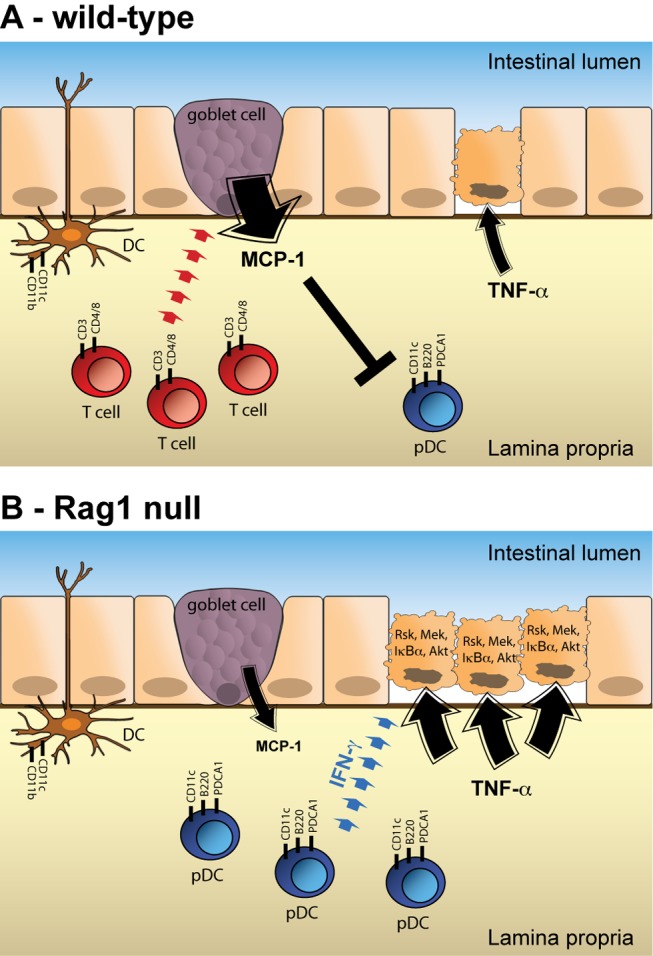
Intestinal epithelial cells exist within a complex environment that affects how they interpret and respond to stimuli. We have applied a multi-scale in vivo systems approach to understand how intestinal immune cells communicate with epithelial cells to regulate responses to inflammatory signals. Multivariate modeling analysis of a large dataset composed of phospho-signals, cytokines, and immune cell populations within the intestine revealed an intimate relationship between immune cells and the epithelial response to TNF-α. Ablation of lymphocytes in the intestine prompted a decrease in the expression of MCP-1, which in turn increased the steady state number of intestinal plasmacytoid dendritic cells (pDCs). This change in the immune compartment affected the intestinal cytokine milieu and subsequent epithelial cell signaling network, with cells becoming hypersensitive to TNF-α-induced apoptosis in a way that could be predicted by mathematical modeling. In summary, we have uncovered a novel cellular network that regulates the response of intestinal epithelial cells to inflammatory stimuli in an in vivo setting.


Conflict of interest statement

The authors have declared that no competing interests exist.

Figures

Figure 1
Figure 1. Loss of intestinal lymphocytes affects TNF-α-induced cell death in the intestinal epithelium.
(A) Schematic representation of our driving hypothesis. Intestinal epithelial homeostasis is regulated by signals from the intestinal microenvironment. By extension, we hypothesized that perturbation of the commensal flora or components of the intestinal immune system (dendritic cells, B cell, T cells, macrophages) will affect how the epithelium responds to acute challenge with TNF-α. (B) Schematic of the experimental design. Wild-type or Rag1 null animals were exposed to TNF-α (5 or 10 µg in PBS) by intravenous injection. Mice were sacrificed at specific time points to compile a time course of TNF-α action. Protein lysates were derived from the duodena and ilea and then subjected to various analyses in order to collect datasets for mathematical modeling. Hypotheses based on computational models were tested by making perturbations and then the model was refined. (C) Immunohistochemistry for cleaved caspase 3 (CC3) in the duodena of untreated and treated animals. TNF-α-induced apoptosis occurs much more frequently in Rag1 null animals than in wild-type. (D) Quantification of caspase 3 cleavage by quantitative Western blotting, demonstrating the effect of Rag1 mutation on the timing and magnitude of TNF-a-induced apoptosis. CC3 data are normalized to vehicle-treated control and plotted on a log2 scale. Error bars represent the SEM for three mice.
Figure 2
Figure 2. The epithelial TNF-α signaling network is altered by the absence of lymphocytes.
(A) Measurement of protein phosphorylation in intestinal tissue lysates by Bio-Plex. The heat map is organized such that the columns represent the phospho-signal time courses, while the rows represent the experimental conditions. Different doses, regions, and genotypes are color-coded. Each phospho-signal is arranged sequentially as a function of time (left to right, 0 to 4 h). The intensity of the heat map represents the average of technical duplicates of the median fluorescence intensity (normalized to the highest value of each signal) resulting from each assay. Data are compiled from three independent experiments for each condition. (B) A three-dimensional PLSDA model constructed using signaling time courses obtained from the different conditions and their correlating apoptotic phenotypes. Each data point represents scores generated by the model, composed of all signaling time courses of a particular experimental condition mapped onto the three-dimensional latent variable space. The three orthogonal latent variable axes separate the scores by apoptotic phenotype: LV1 by the presence or absence of apoptosis, LV2 by the magnitude of apoptosis, and LV3 by the timing of apoptosis. The percentages on the axes represent the percent variance in the dataset captured by a particular LV. (C) Loadings on LV2, the latent variable that correlates the magnitude of TNF-α-induced apoptosis. The y-axis quantifies the positive or negative contribution of a particular signal to LV2.
Figure 3
Figure 3. The cytokine milieu is modulated by the presence or absence of lymphocytes.
(A) Measurement of cytokine protein levels in intestinal tissue lysates by Bio-Plex. The heat map is organized in a similar manner as Figure 2A. Data are compiled from three independent experiments for each condition. (B) A two-dimensional PLSDA model constructed using early cytokine data (0, 0.5, 1 h) obtained from the different conditions and their correlating apoptotic phenotypes. Each data point represents scores generated by the model, composed of the early time points of all cytokines measured of a particular experimental condition mapped onto the two-dimensional latent variable space. The dotted gray line represents the 95% confidence limit of the distribution of the scores. The two orthogonal latent variable axes separate the scores by apoptotic phenotype: LV1 by the magnitude of apoptosis and LV2 by the timing of apoptosis. The percentages on the axes represent the percent variance in the dataset captured by a particular LV. (C) Loadings for the PLSDA model plotted on LV1 and LV2. MCP-1 clusters most significantly with the lowest degree of apoptotic phenotype (low magnitude, late timing).
Figure 4
Figure 4. Neutralization of MCP-1 affects epithelial signaling and TNF-α-induced apoptosis in the intestine.
(A) Effect of MCP-1 neutralization on TNF-α-induced signaling. Phospho-signaling data from the duodena of wild-type mice pre-treated with MCP-1 neutralizing antibody (magenta) were mapped onto the three-dimensional LV space to visually demonstrate the classification of these data with the original Rag1 null dataset. (B) Numerical classification of the wild-type anti-MCP1 signaling dataset into the Rag1 null class. The y-axis shows the numerical result calculated with the PLSDA function of classification into the “high apoptosis” phenotypic class (class 3). The broken red line is the threshold defining classification. Signaling data from the duodenal tissues of control mice pretreated with non-specific antibody (cyan) do not surpass the threshold for classification into this class. (C) Experimental results validating model predictions. Time course of caspase 3 cleavage induced by TNF-α, as determined by quantitative Western blotting after pretreatment with MCP-1 neutralizing antibody (magenta) or non-specific antibody (cyan). CC3 data are normalized to vehicle-treated control and plotted on a log2 scale. Error bars represent the SEM for three mice.
Figure 5
Figure 5. MCP-1 is expressed by secretory epithelial cells.
(A) Expression of MCP-1 in the duodenum of wild-type, Rag1 null, and Mcp1 null mice as demonstrated by immunohistochemistry. The MCP-1-positive cells are goblet and Paneth cells. (B) Expression of MCP-1 in sorted cells. MCP-1 could not be detected in sorted B cells or macrophages. T cells express relatively low levels of MCP-1 in the basal state and induce MCP-1 5-fold after exposure to TNF-α. Epithelial cells also express relatively low levels of MCP-1 in the basal state and induce MCP-1 2,000-fold after exposure to TNF-α. (C) Increase in goblet cell number after treatment with DBZ. Intestinal tissue sections were stained with Alcian blue to highlight goblet cells. (D) Decrease in intestinal lymphocytes after treatment with DBZ. Immune cell types were quantified by FACS. (E) Expression of cytokines after treatment with DBZ. MCP-1 expression is increased in the intestines of animals treated with DBZ. Expression of IL-1β, IL-6, and MIP-1β decreased in animals treated with DBZ.
Figure 6
Figure 6. MCP-1 regulates the presence of plasmacytoid dendritic cells in the intestine.
(A) Quantification of basal immune cell numbers by FACS. Data are normalized to the number of cells in the duodena of wild-type mice. Error bars represent the SEM for six animals. N.D., not detected. (B) Quantification of caspase 3 cleavage in the duodena of Rag1 null animals in which specific immune cell populations have been depleted. Data are normalized to Rag1 null control mice and error bars represent the SEM for three animals. (C) The projection of different perturbation conditions (wild-type, wild-type+anti-MCP-1, Rag1 null, and Rag1 null+anti-PDCA1) along LV2 based on p-Mek, p-IκBα, p-Rsk, and p-Akt were measured at 0.5 h post-TNF-α treatment. These phospho-signals were identified as the primary loadings for LV2, which classifies the apoptotic phenotype by magnitude, of the PLSDA model of epithelial phospho-signaling.
Figure 7
Figure 7. IFN-γ regulates TNF-α signaling and apoptosis in a pDC-dependent manner.
(A) A two-dimensional PLSDA model constructed using early cytokine data from four different experimental conditions (wild-type+IgG, wild-type+anti-MCP-1, Rag1 null+IgG, Rag1 null+anti-PDCA-1) in duodenal lysates. The loadings plot for this four-condition PLSDA model identifies IFN-γ as correlating with high-magnitude apoptosis. (B) Caspase 3 cleavage induced 2 h post-TNF-α administration in the duodena of wild-type mice co-treated with PBS (cyan) or IFN-γ (purple) and Rag1 null mice pretreated with IgG (red) or anti-IFN-γ for 2 h (yellow). Error bars represent SEM for three mice. (C) Projection of different perturbation conditions (wild-type and wild-type+IFN-γ) along LV2 based on p-Mek, p-IκBα, p-Rsk, and p-Akt measured at 0.5 h post-TNF-α treatment.
Figure 8
Figure 8. A model for regulation of TNF-α-induced apoptosis in the intestine.
(A) Regulation of TNF-α response in the wild-type duodenum. In this context, resident T-cells promote MCP-1 expression by epithelial goblet cells. This MCP-1 functions to restrict pDC recruitment to the lamina propria. In the absence of pDCs, apoptosis induced by exogenous TNF-α is relatively low. Neutralization of MCP-1 in wild-type animals results in recruitment of pDCs and enhanced TNF-α-induced apoptosis. (B) Regulation of TNF-α response in the Rag1 null duodenum. The lack of intestinal T cells in Rag1 mice leads to a reduction in MCP-1 expression by goblet cells, allowing for recruitment of pDCs to the lamina propria. These pDCs influence the activation state of TNF-α-induced signaling pathways in epithelial cells, ultimately resulting in enhancement of TNF-α-induced apoptosis. Ablation of pDCs in Rag1 null mice restores the signaling network, and therefore the response to TNF-α, to a wild-type state. (Note, the cell surface markers used to identify each of the relevant immune cell types is specified.)

Comment in

  • Inside the mucosal immune system.
    McGhee JR, Fujihashi K. McGhee JR, et al. PLoS Biol. 2012;10(9):e1001397. doi: 10.1371/journal.pbio.1001397. Epub 2012 Sep 25. PLoS Biol. 2012. PMID: 23049482 Free PMC article.

References

    1. Schrofelbauer B, Hoffmann A (2011) How do pleiotropic kinase hubs mediate specific signaling by TNFR superfamily members? Immunol Rev 244: 29–43. - PMC - PubMed
    1. Micheau O, Tschopp J (2003) Induction of TNF receptor I-mediated apoptosis via two sequential signaling complexes. Cell 114: 181–190. - PubMed
    1. Matsuzawa A, Tseng PH, Vallabhapurapu S, Luo JL, Zhang W, et al. (2008) Essential cytoplasmic translocation of a cytokine receptor-assembled signaling complex. Science 321: 663–668. - PMC - PubMed
    1. Wang L, Du F, Wang X (2008) TNF-alpha induces two distinct caspase-8 activation pathways. Cell 133: 693–703. - PubMed
    1. Abraham C, Cho JH (2009) Inflammatory bowel disease. N Engl J Med 361: 2066–2078. - PMC - PubMed

MeSH terms