. 2012;8(10):e1002716.
doi: 10.1371/journal.pcbi.1002716. Epub 2012 Oct 4.

A model of reward- and effort-based optimal decision making and motor control

Affiliations

A model of reward- and effort-based optimal decision making and motor control

Lionel Rigoux et al. PLoS Comput Biol. 2012.

Abstract

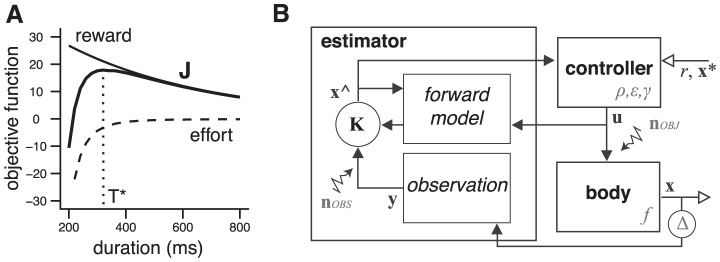
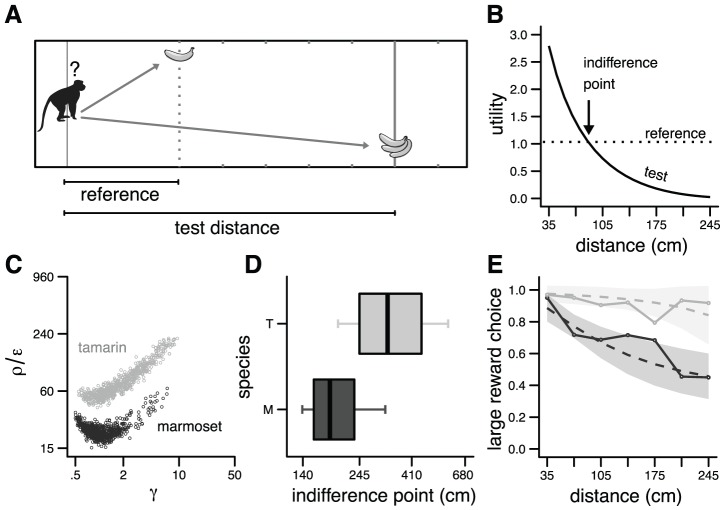
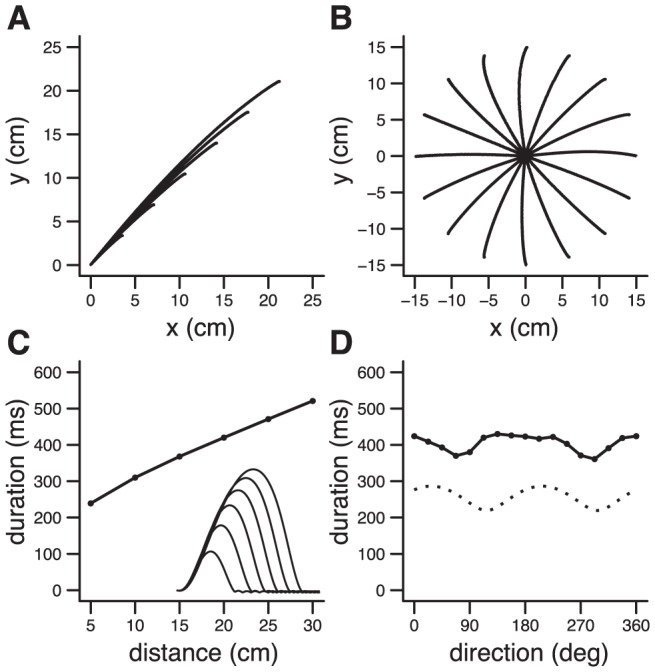
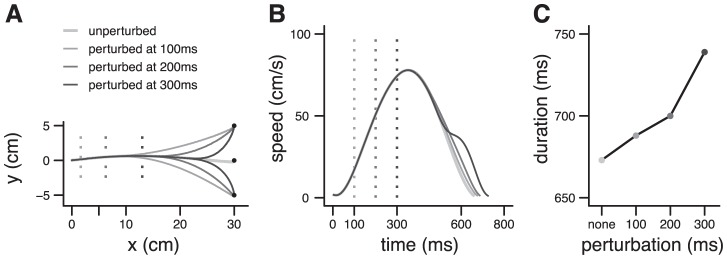
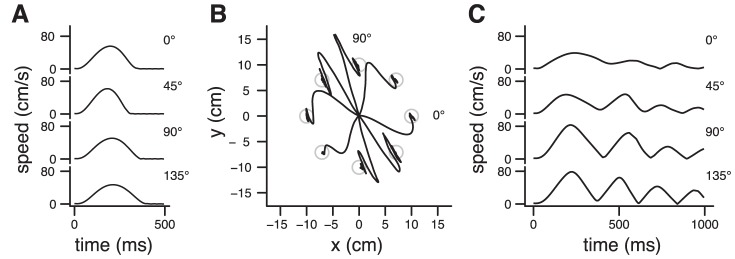
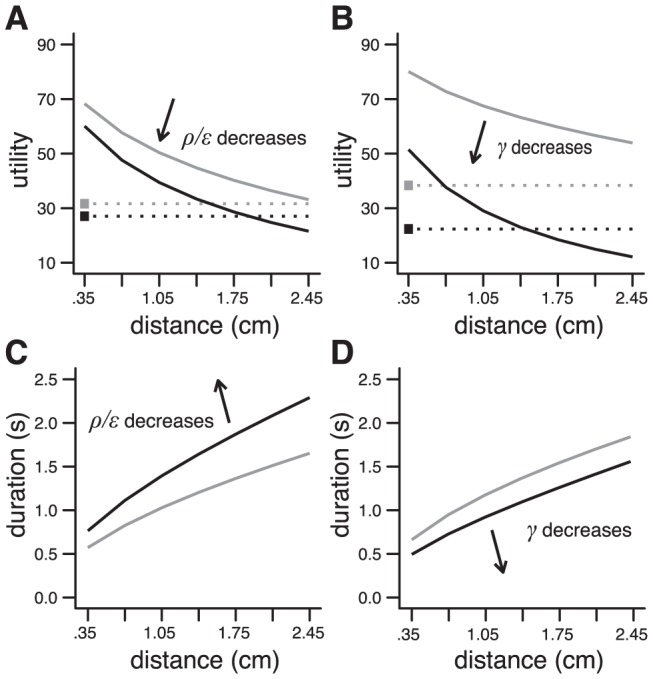
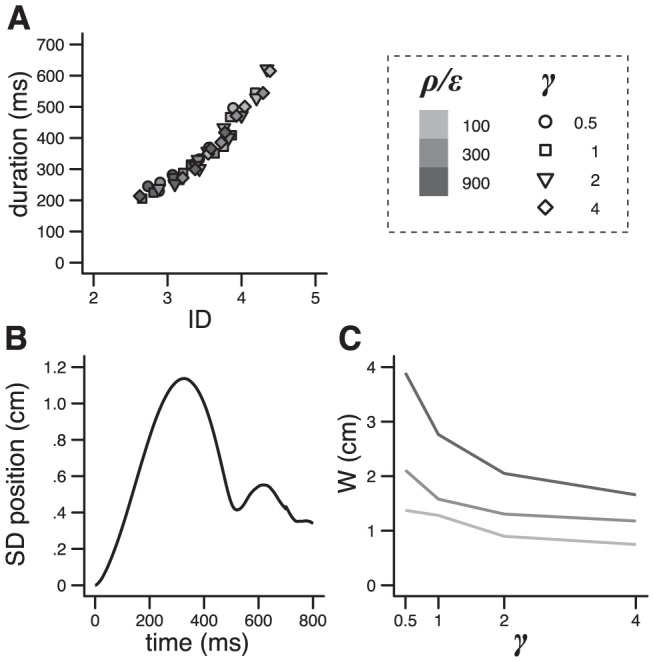
Costs (e.g. energetic expenditure) and benefits (e.g. food) are central determinants of behavior. In ecology and economics, they are combined to form a utility function which is maximized to guide choices. This principle is widely used in neuroscience as a normative model of decision and action, but current versions of this model fail to consider how decisions are actually converted into actions (i.e. the formation of trajectories). Here, we describe an approach where decision making and motor control are optimal, iterative processes derived from the maximization of the discounted, weighted difference between expected rewards and foreseeable motor efforts. The model accounts for decision making in cost/benefit situations, and detailed characteristics of control and goal tracking in realistic motor tasks. As a normative construction, the model is relevant to address the neural bases and pathological aspects of decision making and motor control.


Conflict of interest statement

The authors have declared that no competing interests exist.

Figures

Figure 1
Figure 1. Objective function and model architecture.
A. Objective function (thick) as a function of movement duration, built from the sum of a discounted reward term (thin) and a discounted effort term (dashed). Optimal duration is indicated by a vertical dotted line. B. Architecture of the infinite-horizontal optimal feedback controller. See Text for notations.
Figure 2
Figure 2. Simulation of Stevens .
A. Cost/benefit choice task between a reference option (small reward/short distance) and a test option (large reward/long distance). B. Utility vs distance. The dotted line indicates the utility for the reference option (r = 1, distance = .35 m). The solid line gives the utility for the test option (r = 3) for different distances (range .35–2.45 m). An arrow indicates the distance at which the preference changes. Results obtained with Object I. Parameters: ρ/ε = 1, γ = 2. C. Vigor and discount factors for synthetic monkeys (black: marmosets; gray: tamarins) derived from . The figure was built in the following way. Mean m and standard deviation σ of displacement duration were obtained from Fig. 3 in for each species and each amplitude. For each species, a random sample was drawn from the corresponding Gaussian distribution N(m,σ) for each amplitude, giving two durations. These two durations were used to identify a unique pair of parameters (vigor, discount). Each point corresponds to one pair. See Text for further explanation. D. Indifference points corresponding to the simulated monkeys shown in C (T = tamarin, M = marmoset). Bold bar is the median, hinges correspond to the first and third quartile (50% of the population), and whiskers to the first and ninth decile (90% of the population). E. Probability of choosing the large reward option according the test distance. Solid lines are the experimental data from Stevens . Dashed lines and shaded areas correspond respectively to the mean and the 95% confidence interval of the decision process derived from the simulated utilities and a soft-max rule. The temperature parameter was selected for each monkey to fit empirical data.
Figure 3
Figure 3. Basic characteristics of motor control.
A. Trajectories for movements of different amplitudes (direction: 45 deg; 5, 10, 15, 20, 25, 30 cm). B. Trajectories for movements in different directions (10 cm). C. Amplitude/duration scaling law and velocity profiles (inset) for the movements in A. D. Direction/duration (plain line), direction/apparent inertia (dotted line; arbitrary unit; [31]). Results obtained with Object IIIa. Initial arm position (deg): (75,75). Parameters: r = 40, ρ/ε = 1/300, γ = .5, σSINs = .001, σSDNm = 1.
Figure 4
Figure 4. Simulation of Liu and Todorov .
A. Simulated trajectories for reaching movements toward a target which jumps unexpectedly up or down, 100 ms, 200 ms or 300 ms after movement onset. B. Corresponding velocity profiles. C. Arrival time as a function of the timing of the perturbation. Results obtained with Object IIIa. Initial arm position (deg): (15,120). Same parameters as in Fig. 3.
Figure 5
Figure 5. Simulation of Shadmehr and Mussa-Ivaldi .
A. Velocity profiles for unperturbed movements in four directions. B. Hand trajectories during exposure to a velocity-dependent force field. C. Velocity profiles for perturbed movements in four directions (data from B). Results obtained with Object IIIb. Initial arm position (deg): (15,100). Same parameters as in Fig. 3.
Figure 6
Figure 6. Influence of parameters.
A. Change in the distance/utility relationship induced by a decrease in vigor: ρ/ε from 50 (gray) to 16 (black). Same experiment as in Fig. 2A. Parameters: r = 1, γ = 2. B. Same as A for a decrease in the value of discount factor: γ from 4 (gray) to 1 (black). Parameters: r = 1, ρ/ε = 50. C. Change in movement duration corresponding to the results in A. D. Change in movement duration corresponding to the results in B. Results obtained with Object I.
Figure 7
Figure 7. Fitts' law and variability.
A. Duration as a function of the index of difficulty (ID) for 3 distances (10, 20 and 30 cm) and different values of vigor and discount (see legend). B. Typical spatiotemporal variability (s.d. of position). C. Endpoint variability for different values of the discount factor. Color is for the level of vigor (legend in A). Results obtained with Object II. Parameters: distance = 30 cm, r = 1, ρ/ε = 100, γ = 2, σSINs = .001, σSDNm = 1.

References

    1. Stephens DW, Krebs JR (1986) Foraging Theory. Princeton, NJ: Princeton University Press. 262 p.
    1. Denk F, Walton ME, Jennings KA, Sharp T, Rushworth MF, et al. (2005) Differential involvement of serotonin and dopamine systems in cost-benefit decisions about delay or effort. Psychopharmacology (Berl) 179: 587–596. - PubMed
    1. Stevens JR, Rosati AG, Ross KR, Hauser MD (2005) Will travel for food: Spatial discounting in two new world monkeys. Curr Biol 15: 1855–1860. - PMC - PubMed
    1. Rudebeck PH, Walton ME, Smyth AN, Bannerman DM, Rushworth MF (2006) Separate neural pathways process different decision costs. Nat Neurosci 9: 1161–1168. - PubMed
    1. Walton ME, Kennerley SW, Bannerman DM, Phillips PEM, Rushworth MF (2006) Weighing up the benefits of work: Behavioral and neural analyses of effort-related decision making. Neural Netw 19: 1302–1314. - PMC - PubMed