

Recovery of benthic megafauna from anthropogenic disturbance at a hydrocarbon drilling well (380 m depth in the Norwegian Sea)
- PMID: 23056177
- PMCID: PMC3466215
- DOI: 10.1371/journal.pone.0044114
Recovery of benthic megafauna from anthropogenic disturbance at a hydrocarbon drilling well (380 m depth in the Norwegian Sea)
Abstract
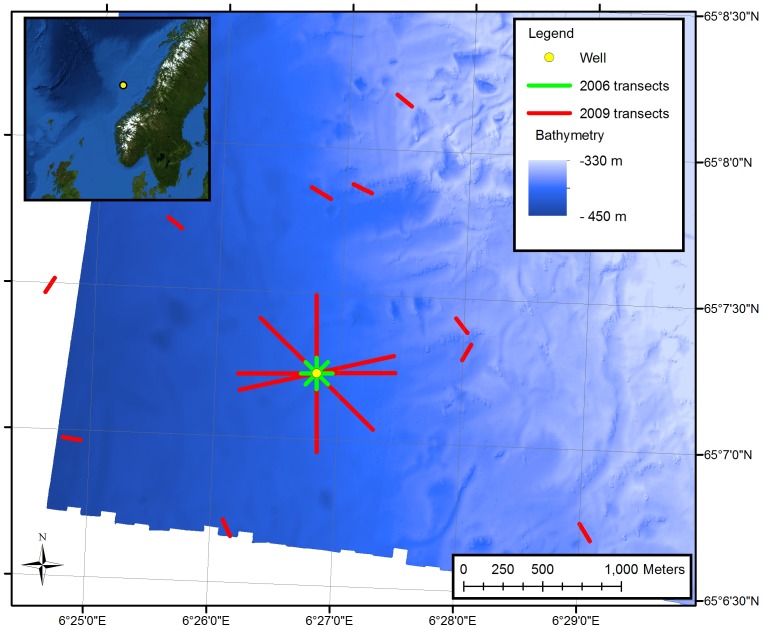
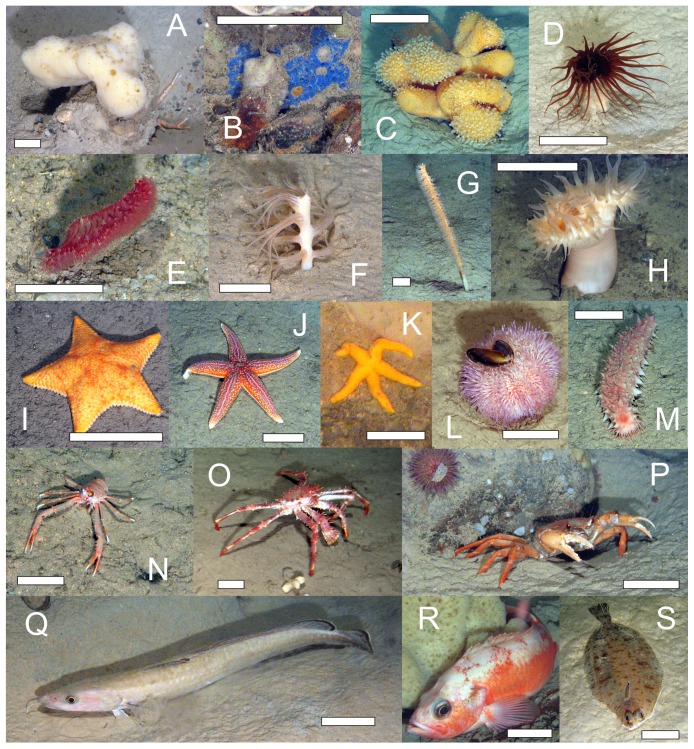
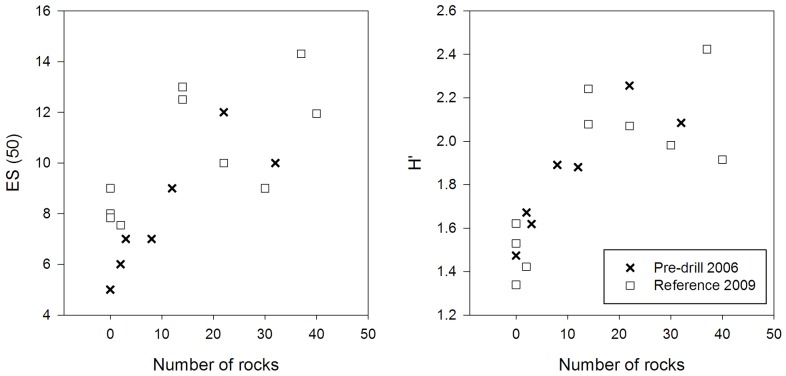
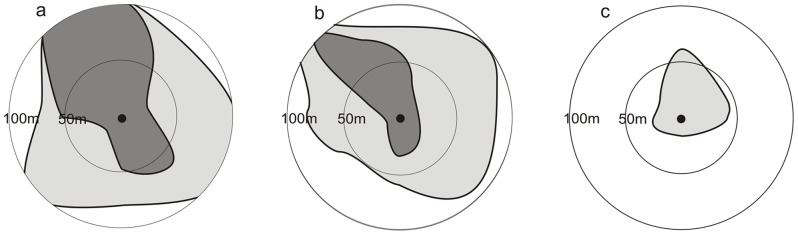
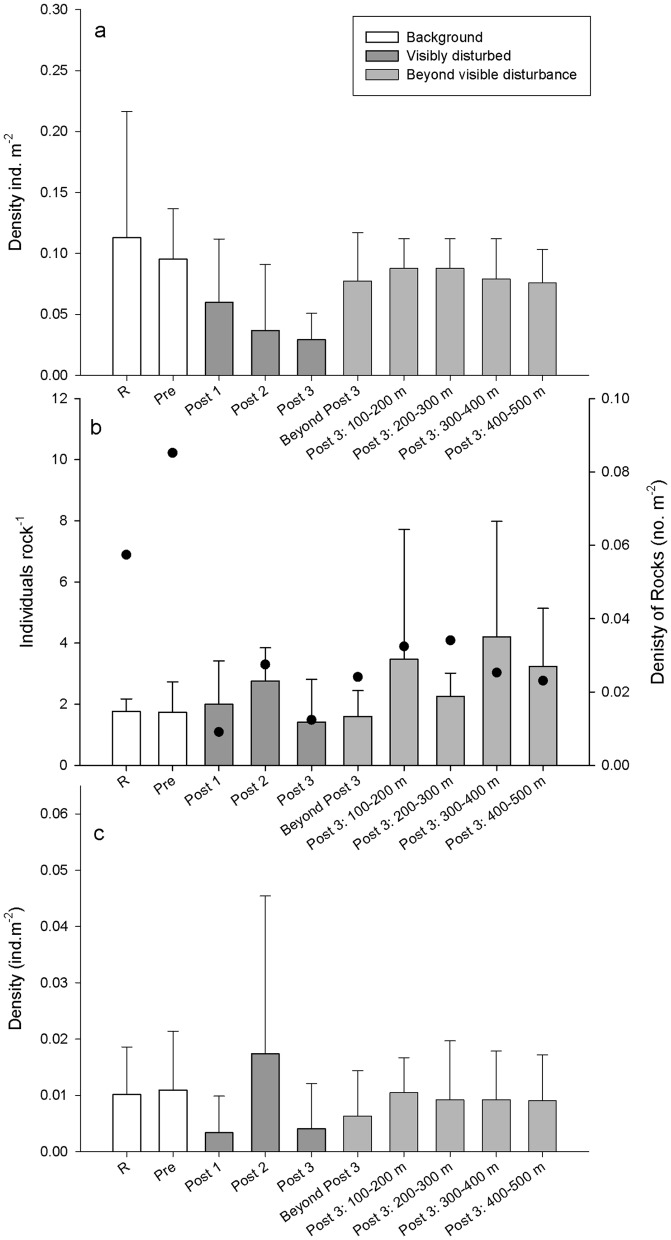
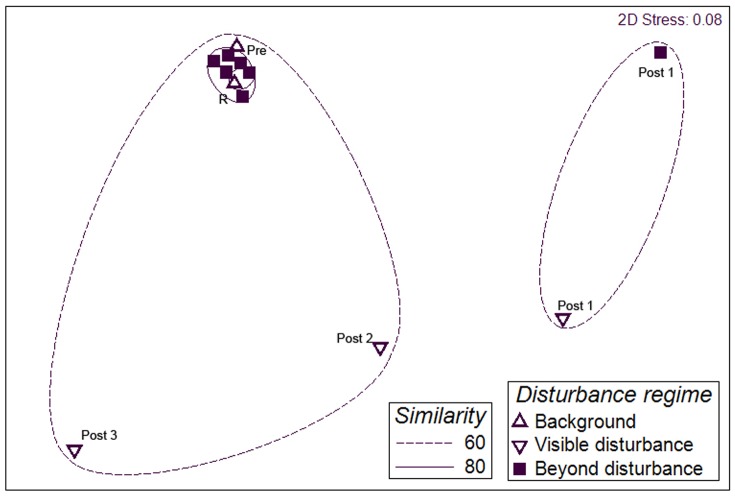
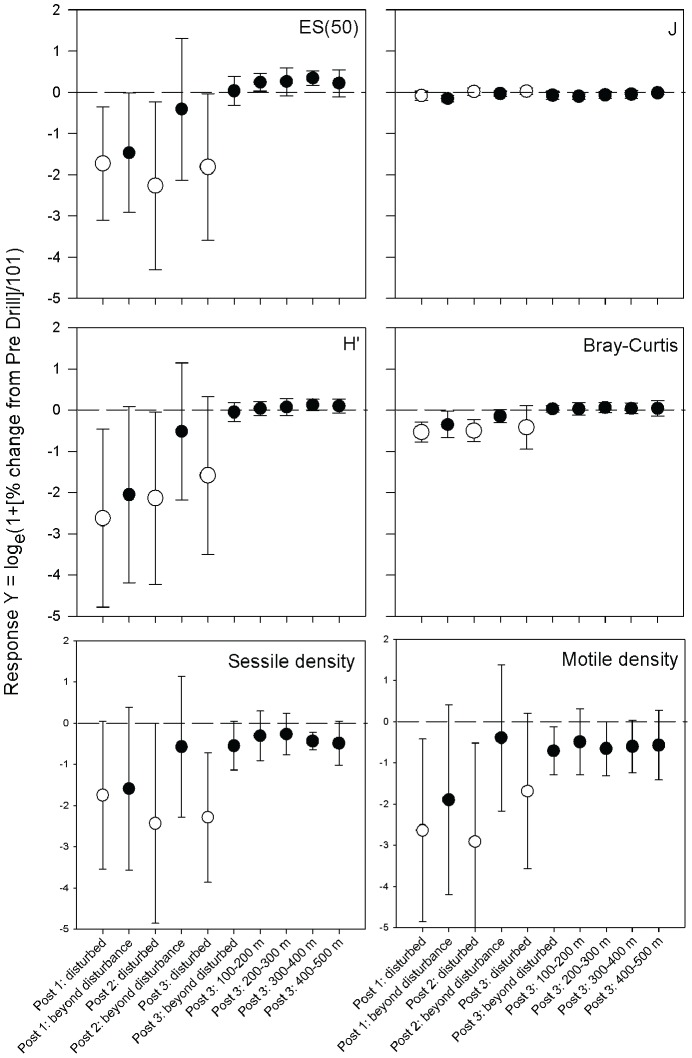
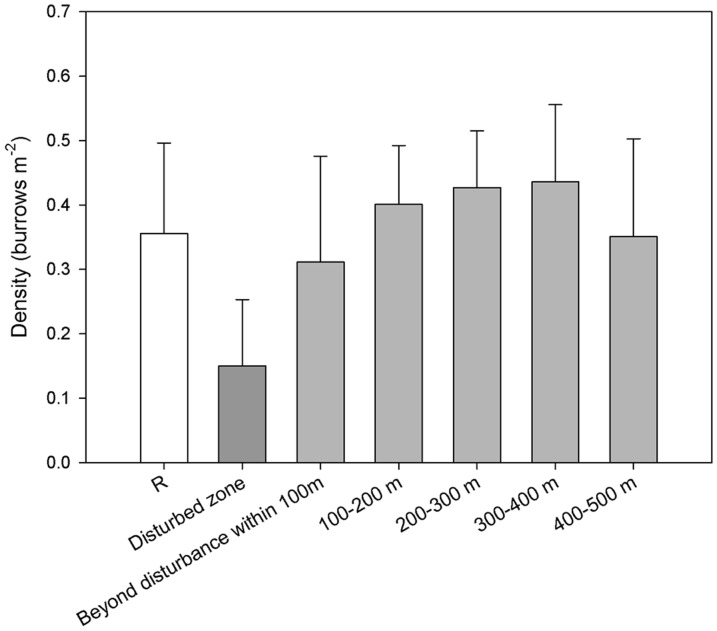
Recovery from disturbance in deep water is poorly understood, but as anthropogenic impacts increase in deeper water it is important to quantify the process. Exploratory hydrocarbon drilling causes physical disturbance, smothering the seabed near the well. Video transects obtained by remotely operated vehicles were used to assess the change in invertebrate megafaunal density and diversity caused by drilling a well at 380 m depth in the Norwegian Sea in 2006. Transects were carried out one day before drilling commenced and 27 days, 76 days, and three years later. A background survey, further from the well, was also carried out in 2009. Porifera (45% of observations) and Cnidaria (40%) dominated the megafauna. Porifera accounted for 94% of hard-substratum organisms and cnidarians (Pennatulacea) dominated on the soft sediment (78%). Twenty seven and 76 days after drilling commenced, drill cuttings were visible, extending over 100 m from the well. In this area there were low invertebrate megafaunal densities (0.08 and 0.10 individuals m(-2)) in comparison to pre-drill conditions (0.21 individuals m(-2)). Three years later the visible extent of the cuttings had reduced, reaching 60 m from the well. Within this area the megafaunal density (0.05 individuals m(-2)) was lower than pre-drill and reference transects (0.23 individuals m(-2)). There was a significant increase in total megafaunal invertebrate densities with both distance from drilling and time since drilling although no significant interaction. Beyond the visible disturbance there were similar megafaunal densities (0.14 individuals m(-2)) to pre-drilling and background surveys. Species richness, Shannon-Weiner diversity and multivariate techniques showed similar patterns to density. At this site the effects of exploratory drilling on megafaunal invertebrate density and diversity seem confined to the extent of the visible cuttings pile. However, elevated Barium concentration and reduced sediment grain size suggest persistence of disturbance for three years, with unclear consequences for other components of the benthic fauna.
Conflict of interest statement
Figures
References
-
- Gage JD (2001) Deep-sea benthic community and environmental impact assessment at the Atlantic Frontier. Continental Shelf Research 21: 957–986.
-
- Pinder D (2001) Offshore oil and gas: global resource knowledge and technological change. Ocean & Coastal Management 44: 579–600.
-
- Kotchen MJ, Burger NE (2007) Should we drill in the Arctic National Wildlife Refuge? An economic perspective. Energy Policy 35: 4720–4729.
-
- Jones DOB, Hudson IR, Bett BJ (2006) Effects of physical disturbance on the cold-water megafaunal communities of the Faroe-Shetland Channel. Marine Ecology Progress Series 319: 43–54.
-
- Hylland K, Tollefsen KE, Ruus A, Jonsson G, Sundt RC, et al. (2008) Water column monitoring near oil installations in the North Sea 2001–2004. Marine Pollution Bulletin 56: 414–429. - PubMed
Publication types
MeSH terms
Substances
LinkOut - more resources
Full Text Sources
