Multicenter Study
. 2012;7(10):e46143.
doi: 10.1371/journal.pone.0046143. Epub 2012 Oct 2.

Acute plasma biomarkers of T cell activation set-point levels and of disease progression in HIV-1 infection

Affiliations
Multicenter Study

Acute plasma biomarkers of T cell activation set-point levels and of disease progression in HIV-1 infection

Anne-Sophie Liovat et al. PLoS One. 2012.

Abstract

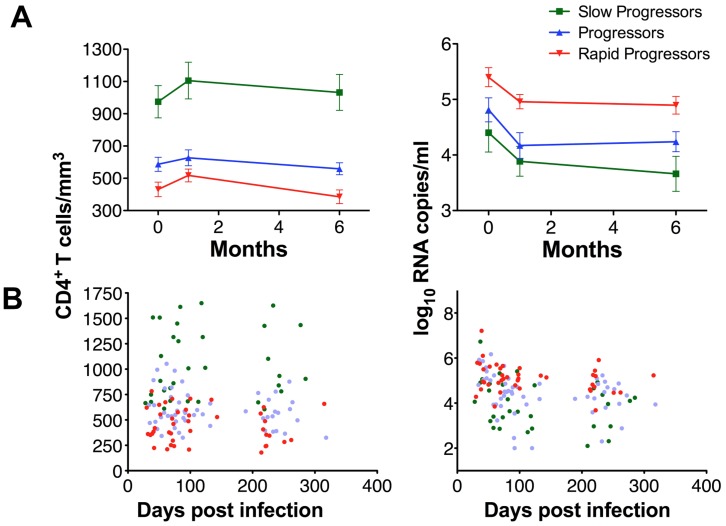
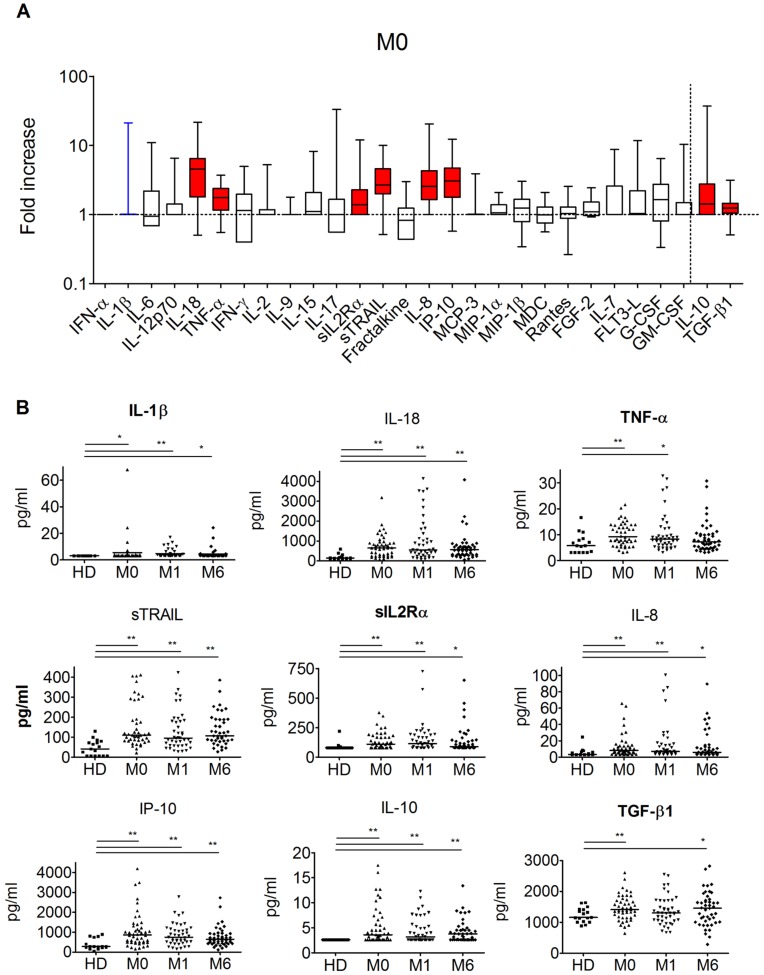
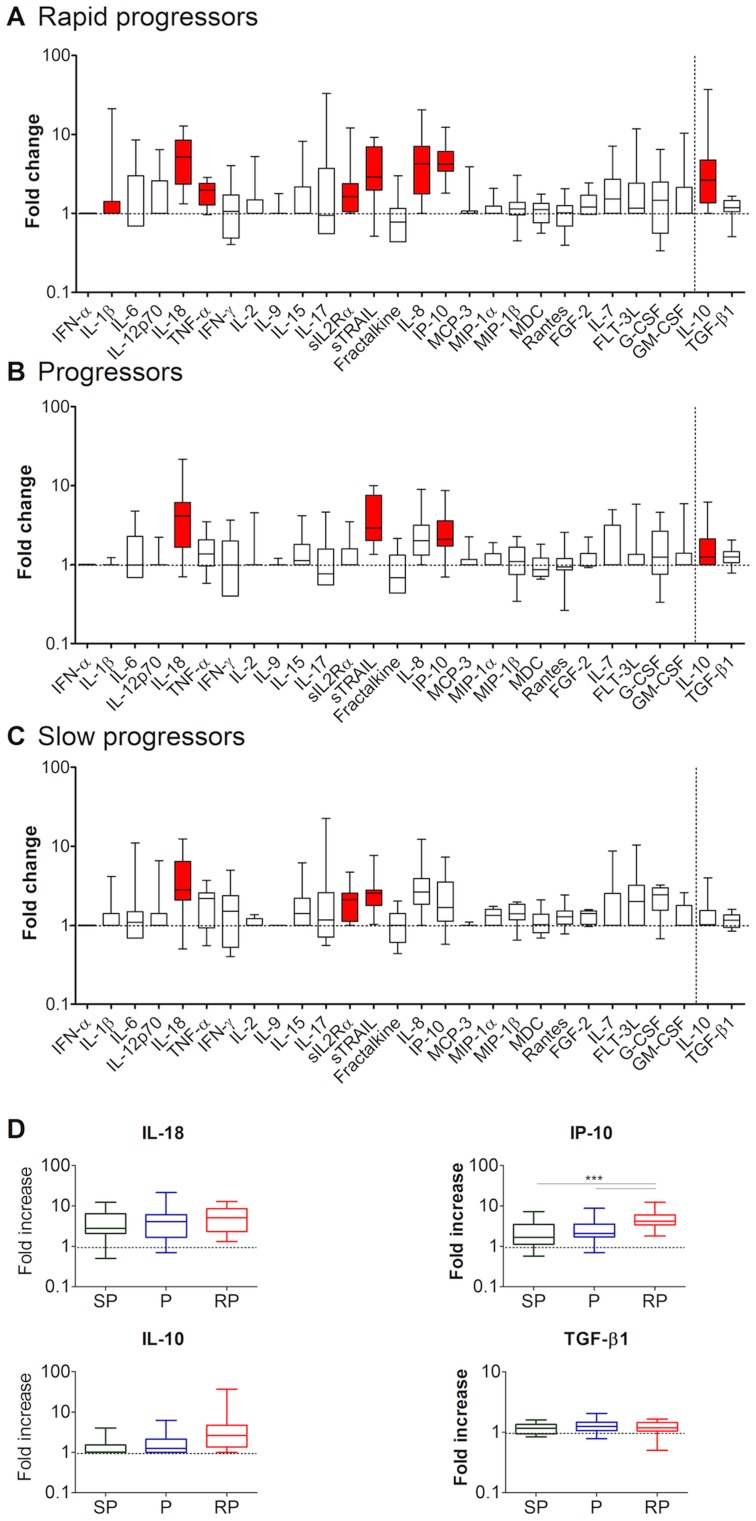
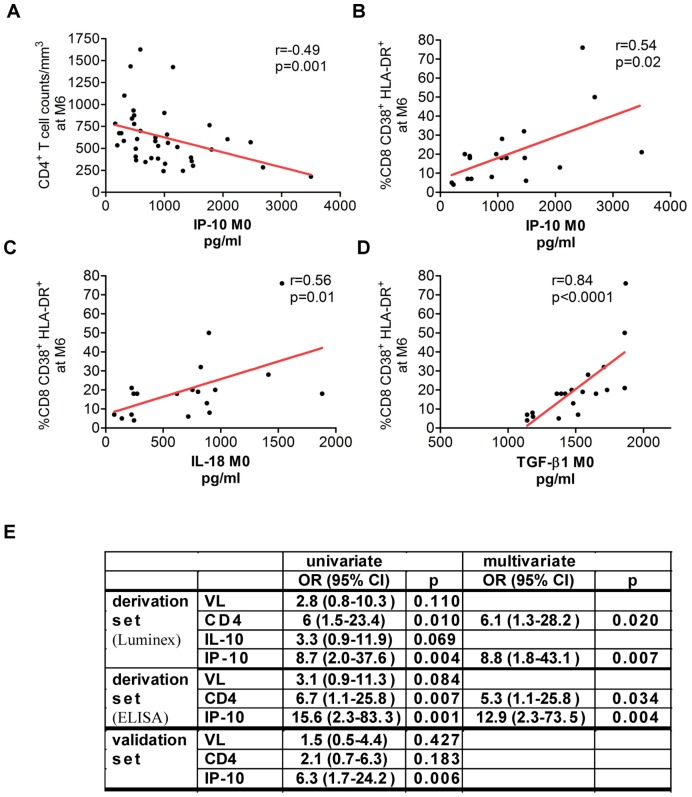
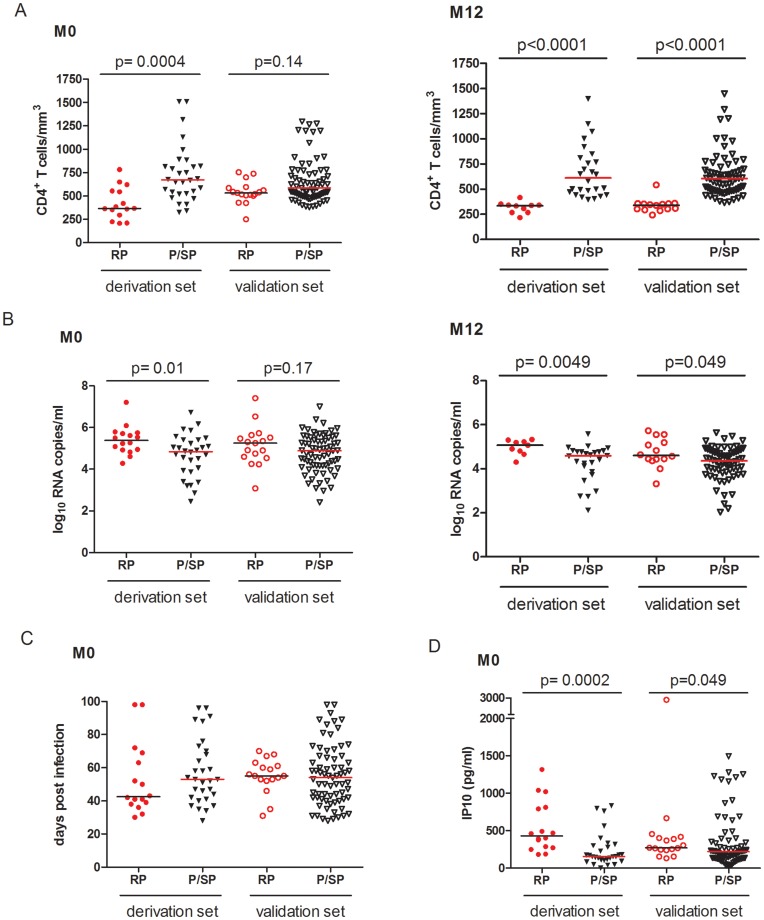
T cell activation levels, viral load and CD4(+) T cell counts at early stages of HIV-1 infection are predictive of the rate of progression towards AIDS. We evaluated whether the inflammatory profile during primary HIV-1 infection is predictive of the virological and immunological set-points and of disease progression. We quantified 28 plasma proteins during acute and post-acute HIV-1 infection in individuals with known disease progression profiles. Forty-six untreated patients, enrolled during primary HIV-1 infection, were categorized into rapid progressors, progressors and slow progressors according to their spontaneous progression profile over 42 months of follow-up. Already during primary infection, rapid progressors showed a higher number of increased plasma proteins than progressors or slow progressors. The plasma levels of TGF-β1 and IL-18 in primary HIV-1 infection were both positively associated with T cell activation level at set-point (6 months after acute infection) and together able to predict 74% of the T cell activation variation at set-point. Plasma IP-10 was positively and negatively associated with, respectively, T cell activation and CD4(+) T cell counts at set-point and capable to predict 30% of the CD4(+) T cell count variation at set-point. Moreover, plasma IP-10 levels during primary infection were predictive of rapid progression. In primary infection, IP-10 was an even better predictor of rapid disease progression than viremia or CD4(+) T cell levels at this time point. The superior predictive capacity of IP-10 was confirmed in an independent group of 88 HIV-1 infected individuals. Altogether, this study shows that the inflammatory profile in primary HIV-1 infection is associated with T cell activation levels and CD4(+) T cell counts at set-point. Plasma IP-10 levels were of strong predictive value for rapid disease progression. The data suggest IP-10 being an earlier marker of disease progression than CD4(+) T cell counts or viremia levels.


Conflict of interest statement

Competing Interests: The authors have declared that no competing interests exist.

Figures

Figure 1
Figure 1. Virological and immunological characteristics of the 46 HIV-1 infected patients with three distinct disease progression profiles.
(A) CD4+ T cell counts (left) and viremia levels (right) are shown over time for the 46 patients, who were divided into 3 groups: slow progressors (in green, 11 patients), progressors (in blue, 19 patients), rapid progressors (in red, 16 patients). The data were determined in primary infection (M0), as well as 1 month (M1) and 6 months (M6) later. The data of the patients are grouped together and the mean and SEM values are shown for each analyzed time point (M0, M1, M6). (B) The CD4+ T cell counts (left) and viremia levels (right) are shown for each single patient according to the estimated time post-infection.
Figure 2
Figure 2. Plasma protein levels in HIV-1 infected patients.
(A) The levels of 28 proteins in the plasma of 46 acutely infected patients (M0) are expressed as fold change compared to the levels in healthy donors (N = 17). The order of the proteins is presented according to their function (pro-inflammatory, adaptive, IFN-inducible, chemoattractants, hematopoietic and anti-inflammatory). The anti-inflammatory cytokines are presented on the right side of the figure. The dotted horizontal line at Y = 1 corresponds to the value in healthy donors. The boxes represent the median and the 25th and 75th percentile, with the line in the middle of the boxes corresponding to the median value. Colored boxes stand for the cytokines, whose levels were significantly different from healthy donors: blue boxes when p<0.05 (as it was the case for IL-1β) and red boxes when p<0.008 (M&W test). (B) Protein concentrations at M0, M1 and M6 of the soluble factors that were elevated at M0. The data are expressed in pg/ml, HD: healthy donors, M: months. Cytokine concentrations below the limit of detection were arbitrarily set at the level of the limit of detection. Dot-plots marked with one asterisk (*) (p<0.05) or two asteriks (**) (p<0.008) represent the cytokines, whose levels were significantly different from healthy donors (M&W test).
Figure 3
Figure 3. Plasma protein levels at M0 according to disease progression profiles.
The cytokine profiles at M0 are shown for each group of patients: 16 rapid progressors (A), 19 progressors (B), and 11 slow progressors (C). Color code and statistical analyses are as described in Figure 2 (corrected threshold, p<0.005). The dotted horizontal line corresponds to the value in healthy donors. (D) Comparison of protein concentrations between the 3 groups of patients (SP, P and RP). Four representative cytokines are shown. The cytokines increasing significantly over groups were IP-10 and IL-10 (Cuzick’s test, p<0.007). When comparing the groups two by two, out of 28 proteins tested, the levels were different only for IP-10 (M&W test,***: p<0.005).
Figure 4
Figure 4. Cytokines predictive of immunological set-point levels. (A–E)
Cytokine concentrations in plasma at M0 have been plotted against CD4+ T cell counts and T cell activation (CD3+CD8+CD38+HLA-DR+) at M6. Six patients, including 4 who were treated at M6, were excluded from the analysis at M6. T cell activation levels were available for 19 patients at M6 (4 SP, 7 SP, 8 RP). The correlations were thus analyzed in 40 patients regarding CD4+ T cell counts and viral load and for 19 patients regarding T cell activation. (A) IP-10 levels at M0 plotted against T CD4+ counts at M6. (B) IP-10 levels at M0 plotted against T cell activation at M6. (C) IL-18 levels at M0 plotted against T cell activation at M6. (D) TGF-β1 concentrations at M0 plotted against T cell activation at M6. The red line indicates that both the Spearman correlation and the linear regression analysis were significant. (E) Regression analysis for evaluation of the capacity of CD4+ T cell counts, VL and cytokines at M0 to predict rapid disease progression. Values obtained for both the derivation set (Luminex and ELISA) and the validation set are shown. Median values of CD4+ T cell counts, VL and cytokine levels were used: VL > = 5 log; CD4<570 cells (derivation set); CD4<546 cells (validation set); IP-10> = 869 pg/ml (derivation set, Luminex); IP-10> = 247 pg/ml (derivation set, ELISA); IP-10> = 232 pg/ml (validation set, ELISA).
Figure 5
Figure 5. Immunological, virological and clinical characteristics of rapid progressors versus progressors and slow progressors assembled within patients of the derivation and validation sets.
The derivation set comprised 46 patients (except for IP-10, where values based on the ELISA were available for only 45 patients). The validation set corresponded to 88 patients for all markers. Differences between rapid progressors and the other patients are indicated with the presence of a p value (M&W test). P values below 0.05 were considered to be significant. There was no significant difference regarding the time of enrollment at M0 (estimated days post-infection). (A) CD4+ T cells at M0 and M12; (B) Viremia at M0 and M12; (C) number of estimated days post-infection at M0; (D) Plasma IP-10 concentration at M0. M = month.

References

    1. Giorgi JV, Hultin LE, McKeating JA, Johnson TD, Owens B, et al. (1999) Shorter survival in advanced human immunodeficiency virus type 1 infection is more closely associated with T lymphocyte activation than with plasma virus burden or virus chemokine coreceptor usage. J Infect Dis 179: 859–870. - PubMed
    1. Shi M, Taylor JM, Fahey JL, Hoover DR, Munoz A, et al. (1997) Early levels of CD4, neopterin, and beta 2-microglobulin indicate future disease progression. J Clin Immunol 17: 43–52. - PubMed
    1. Hazenberg MD, Otto SA, van Benthem BH, Roos MT, Coutinho RA, et al. (2003) Persistent immune activation in HIV-1 infection is associated with progression to AIDS. Aids 17: 1881–1888. - PubMed
    1. Goujard C, Bonarek M, Meyer L, Bonnet F, Chaix ML, et al. (2006) CD4 cell count and HIV DNA level are independent predictors of disease progression after primary HIV type 1 infection in untreated patients. Clin Infect Dis 42: 709–715. - PubMed
    1. Deeks SG, Kitchen CM, Liu L, Guo H, Gascon R, et al. (2004) Immune activation set point during early HIV infection predicts subsequent CD4+ T-cell changes independent of viral load. Blood 104: 942–947. - PubMed

Publication types

MeSH terms