. 2012;7(10):e46191.
doi: 10.1371/journal.pone.0046191. Epub 2012 Oct 2.

Detectable changes in the blood transcriptome are present after two weeks of antituberculosis therapy

Affiliations

Detectable changes in the blood transcriptome are present after two weeks of antituberculosis therapy

Chloe I Bloom et al. PLoS One. 2012.

Abstract

Rationale: Globally there are approximately 9 million new active tuberculosis cases and 1.4 million deaths annually. Effective antituberculosis treatment monitoring is difficult as there are no existing biomarkers of poor adherence or inadequate treatment earlier than 2 months after treatment initiation. Inadequate treatment leads to worsening disease, disease transmission and drug resistance.

Objectives: To determine if blood transcriptional signatures change in response to antituberculosis treatment and could act as early biomarkers of a successful response.

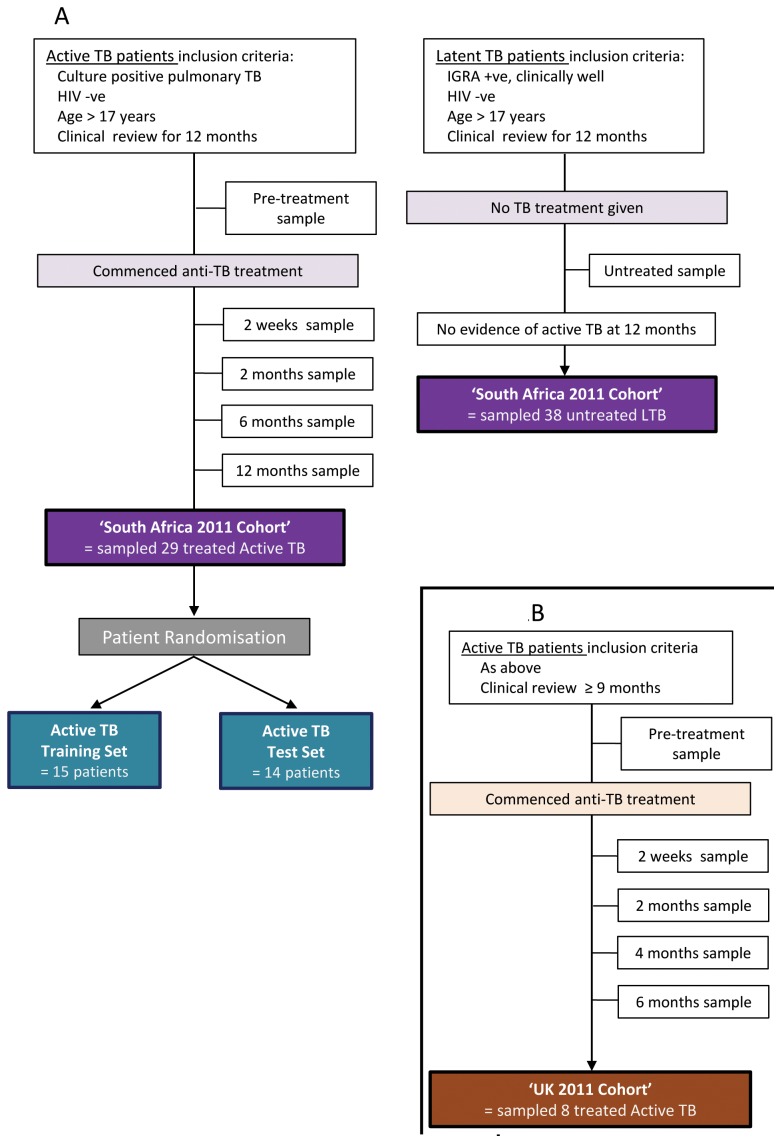
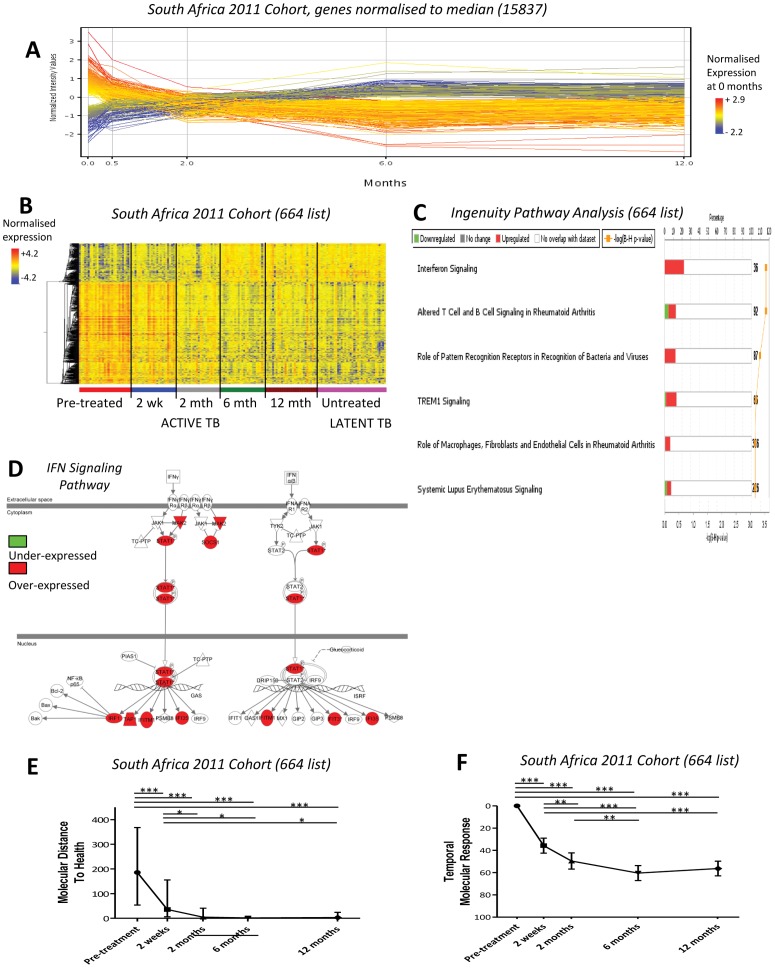
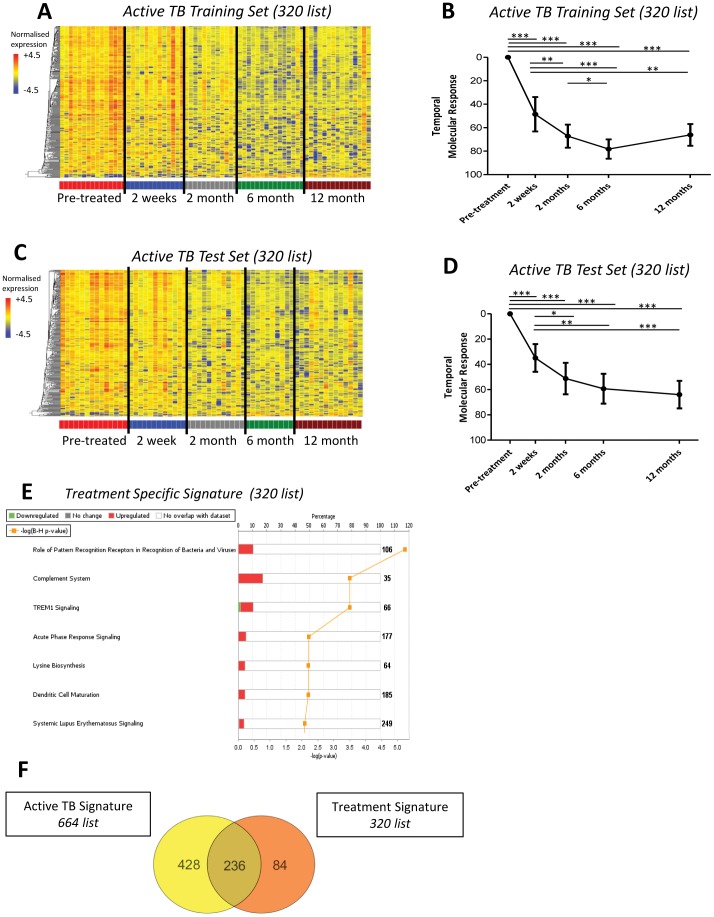
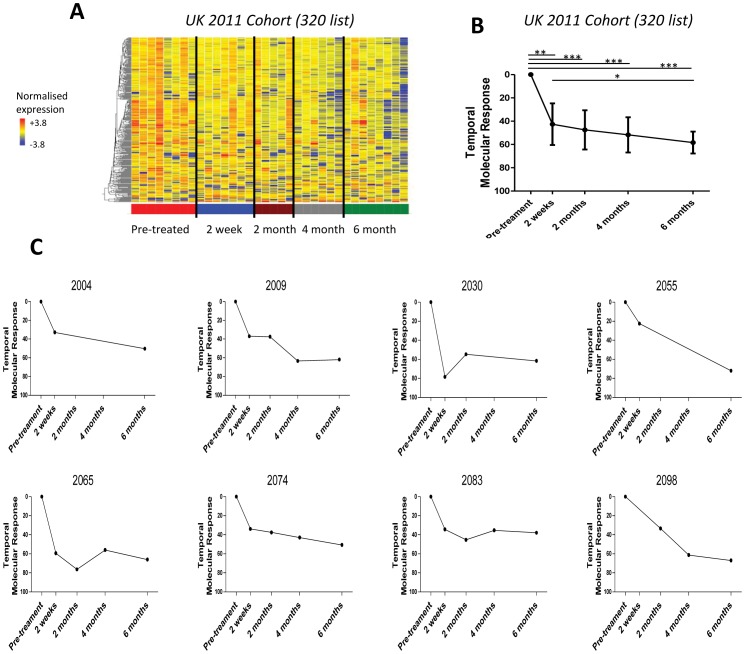
Methods: Blood transcriptional profiles of untreated active tuberculosis patients in South Africa were analysed before, during (2 weeks and 2 months), at the end of (6 months) and after (12 months) antituberculosis treatment, and compared to individuals with latent tuberculosis. An active-tuberculosis transcriptional signature and a specific treatment-response transcriptional signature were derived. The specific treatment response transcriptional signature was tested in two independent cohorts. Two quantitative scoring algorithms were applied to measure the changes in the transcriptional response. The most significantly represented pathways were determined using Ingenuity Pathway Analysis.

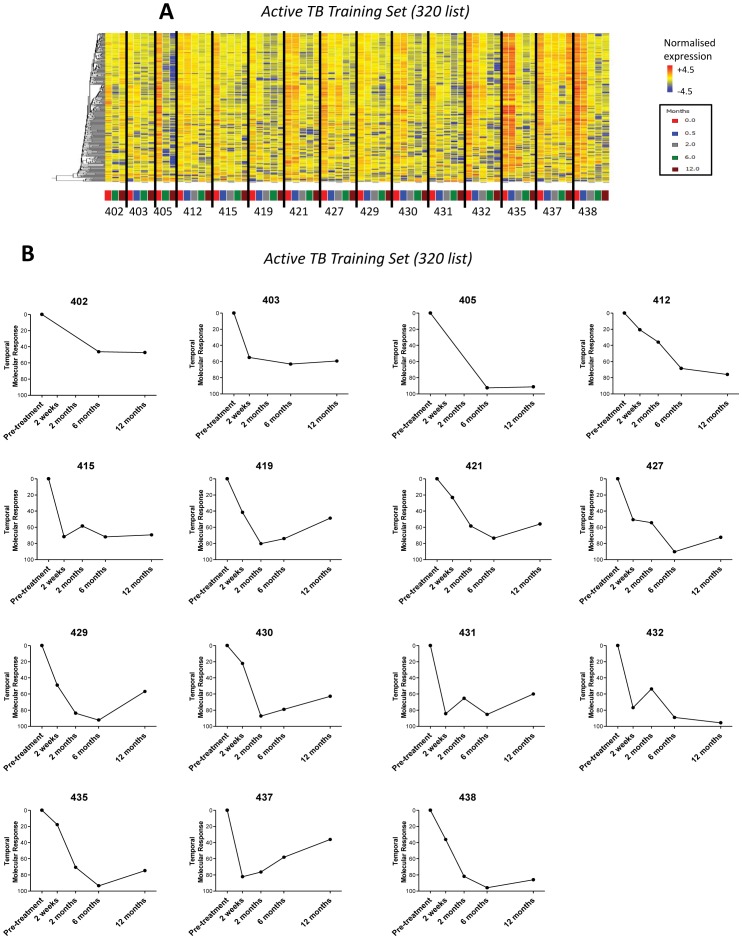
Results: An active tuberculosis 664-transcript signature and a treatment specific 320-transcript signature significantly diminished after 2 weeks of treatment in all cohorts, and continued to diminish until 6 months. The transcriptional response to treatment could be individually measured in each patient.

Conclusions: Significant changes in the transcriptional signatures measured by blood tests were readily detectable just 2 weeks after treatment initiation. These findings suggest that blood transcriptional signatures could be used as early surrogate biomarkers of successful treatment response.


Conflict of interest statement

Competing Interests: The authors declare that co-author Robert J Wilkinson is a PLOS ONE Editorial Board member. They also confirm that this does not alter their adherence to all the PLOS ONE policies on sharing data and materials, as detailed online in the PLOS ONE guide for authors and therefore will not alter their policy on data-sharing and materials. The authors declare their patent with details as shown here. U.S. Patent Application. Title: Early Detection of Tuberculosis Treatment Response. Serial No.: 61/610,121. Filing Date: March 13, 2012. Our File No.: BHCS:1146. There are no other relevant declarations relating to employment, consultancy, patents, products in development or modified products etc. Furthermore, the authors also confirm that this does not alter their adherence to all the PLOS ONE policies on sharing data and materials, as detailed online in the guide for authors. Dr. Jacques Banchereau no longer works at Hoffmann-La Roche Inc. as of the last month, but is still affiliated with Baylor Institute for Immunology Research. This does not alter the authors' adherence to all the PLOS ONE policies on sharing data and materials.

Figures

Figure 1
Figure 1. Numbers enrolled and assigned to cohorts.
(A) South Africa: A total of 67 active and latent TB patients were enrolled into the untreated South Africa 2011 Cohort. A total of 29 active TB patients were included in the treated South Africa 2011 Cohort. 15 were randomised into the Active TB Training Set and 14 into the Active TB Test Set. (B) UK: A total of 8 active TB patients were enrolled into the treated UK 2011 Cohort.
Figure 2
Figure 2. A blood transcriptional response is detectable after only 2 weeks of treatment.
(A) Profile plot of all detectable transcripts (15837) obtained without any filtering, in the treated active TB patients in the South Africa 2011 cohort. It can be seen that gene expression changes after just 2 weeks of treatment. (B) 664 differentially expressed transcripts between untreated active and latent TB patients in the untreated South Africa 2011 cohort, were obtained by twofold change from the median and stringent statistical filtering (Mann Whitney, Bonferroni p<0.01). The heatmap shows the dynamic change of gene expression in response to treatment in the treated South Africa 2011 cohort normalised to the median of all transcripts. (C) Ingenuity Pathway Analysis (IPA) of the 664 transcripts shows the top significant pathways. (D) Interferon signaling pathway from the 664 list in IPA. (E) Weighted molecular distance to health (MDTH) of the treated South Africa 2011 cohort shows the signature significantly diminishes over time (linear mixed models, bars represent median & IQR, *** = p<0.001, ** = p<0.01, * = p<0.05). (F) Temporal molecular response further shows significant and early changes in response to anti-TB treatment (linear mixed models, bars represent mean & 95% confidence intervals).
Figure 3
Figure 3. Specific treatment response signature significantly diminishes at 2 weeks onwards.
A specific TB treatment response signature was derived from significantly differentially expressed genes between untreated samples in the South Africa Active TB Training Set and their corresponding 6 month samples, 320 transcripts. (A) Heatmap of South Africa 2011 Active TB Training Set, normalised to the median of all transcripts, shows transcripts differentiating over time in response to treatment. (B) Temporal molecular response further shows significant and early changes in response to TB treatment in the Active TB Training Set (linear mixed models, bars represent mean & 95% confidence intervals, *** = p<0.001, ** = p<0.01, * = p<0.05). (C) Heatmap of South Africa 2011 Active TB Test Set, normalised to the median of all transcripts, shows transcripts differentiating over time in response to treatment. (D) Temporal molecular response also shows in the Active TB Test Set significant and early changes in response to TB treatment. (E) IPA of the 320 transcripts showing the most significant pathways. (F) Venn diagram shows many overlapping genes between the active TB 664-transcript signature and the treatment specific 320-signature.
Figure 4
Figure 4. Individual patient’s transcriptional response occurred at a variable rate.
320 gene list, differentially expressed genes derived from comparing the untreated expression profiles and their corresponding end of treatment (6 months) expression profiles in the South Africa 2011 Active TB Training Set. (A) Heatmap of South Africa 2011 cohort Active TB Training Set, normalised to the median of all transcripts, shows hierarchical clustered transcripts differentiating over time per individual. (B) Each patient’s temporal molecular response diminishes in the Active TB Training Set cohort.
Figure 5
Figure 5. Change in treatment specific signature is validated in an independent UK cohort.
320 gene list derived from the differentially expressed genes between the untreated and 6 month treated samples in the treated South Africa 2011 cohort. (A) Heatmap of the treated UK 2011 Cohort, normalised to the median of all transcripts, shows diminution of the treatment specific transcriptional signature in the UK cohort in response to successful anti-TB treatment. (B) Temporal molecular response shows significant changes in response at 2 weeks in the UK cohort (linear mixed models, bars represent mean & 95% confidence intervals, *** = p<0.001, ** = p<0.01, * = p<0.05). (C) A diminished response can be seen in each patient by their temporal molecular response.

References

    1. Young DB, Perkins MD, Duncan K, Barry CE 3rd (2008) Confronting the scientific obstacles to global control of tuberculosis. J Clin Invest 118: 1255–1265. - PMC - PubMed
    1. WHO (2010) Global tuberculosis control. World Health Organisation.
    1. Pfyffer GE, Cieslak C, Welscher HM, Kissling P, Rusch-Gerdes S (1997) Rapid detection of mycobacteria in clinical specimens by using the automated BACTEC 9000 MB system and comparison with radiometric and solid-culture systems. J Clin Microbiol 35: 2229–2234. - PMC - PubMed
    1. Boehme CC, Nabeta P, Hillemann D, Nicol MP, Shenai S, et al. (2010) Rapid molecular detection of tuberculosis and rifampin resistance. N Engl J Med 363: 1005–1015. - PMC - PubMed
    1. CCDC (2007) Center for Communicable Disease Control and Prevention. Reported Tuberculosis in the United States, 2007. C. U.S. Department of Health and Human Services. Atlanta, GA.

Publication types

MeSH terms

Associated data