. 2012;7(10):e46231.
doi: 10.1371/journal.pone.0046231. Epub 2012 Oct 2.

Gut microbiota composition is correlated to grid floor induced stress and behavior in the BALB/c mouse

Affiliations

Gut microbiota composition is correlated to grid floor induced stress and behavior in the BALB/c mouse

Katja Maria Bangsgaard Bendtsen et al. PLoS One. 2012.

Abstract

Stress has profound influence on the gastro-intestinal tract, the immune system and the behavior of the animal. In this study, the correlation between gut microbiota composition determined by Denaturing Grade Gel Electrophoresis (DGGE) and tag-encoded 16S rRNA gene amplicon pyrosequencing (454/FLX) and behavior in the Tripletest (Elevated Plus Maze, Light/Dark Box, and Open Field combined), the Tail Suspension Test, and Burrowing in 28 female BALB/c mice exposed to two weeks of grid floor induced stress was investigated. Cytokine and glucose levels were measured at baseline, during and after exposure to grid floor. Stressing the mice clearly changed the cecal microbiota as determined by both DGGE and pyrosequencing. Odoribacter, Alistipes and an unclassified genus from the Coriobacteriaceae family increased significantly in the grid floor housed mice. Compared to baseline, the mice exposed to grid floor housing changed the amount of time spent in the Elevated Plus Maze, in the Light/Dark Box, and burrowing behavior. The grid floor housed mice had significantly longer immobility duration in the Tail Suspension Test and increased their number of immobility episodes from baseline. Significant correlations were found between GM composition and IL-1α, IFN-γ, closed arm entries of Elevated Plus Maze, total time in Elevated Plus Maze, time spent in Light/Dark Box, and time spent in the inner zone of the Open Field as well as total time in the Open Field. Significant correlations were found to the levels of Firmicutes, e.g. various species of Ruminococccaceae and Lachnospiraceae. No significant difference was found for the evaluated cytokines, except an overall decrease in levels from baseline to end. A significant lower level of blood glucose was found in the grid floor housed mice, whereas the HbA1c level was significantly higher. It is concluded that grid floor housing changes the GM composition, which seems to influence certain anxiety-related parameters.


Conflict of interest statement

Competing Interests: The authors have declared that no competing interests exist.

Figures

Figure 1
Figure 1. Blood glucose measurements during the study.
For both groups measurements were taken at baseline, on day −5, +2, +9 of grid floor exposure for the test group and at the end of the study (mmol/L, mean and SD).
Figure 2
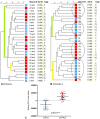
Figure 2. GM composition.
(Blue: control mice, Red: grid floor housed mice). A. DGGE-profile cluster analysis similarity tree from end fecal samples. The mice clustered strongly after gel (green, yellow and purple lines) and after cage allocation (rounded squares). There was no clear clustering according to housing. Overall similarity was 59.61%±4.68. B. DGGE-profile cluster analysis similarity tree from end cecal samples. The mice clustered according to housing (circles) independent of gel (green and yellow) and cage allocation (rounded squares). The overall similarity was 64.07%±5.64. C. Scatter plot of the y-component of similarity-based cecal PCA-plot (mean and SD). Difference between control mice (−107563±108957) and grid floor housed mice (107563±84155) is significant (p<0.01).
Figure 3
Figure 3. 16S rRNA gene 454/FLX based pyrosequencing of cecal content.
(Blue: control mice, Red: grid floor housed mice). A. Jackknifed replicate PCA plot. The plot is based on the phylogenetic distance matrix showing clustering of mice according to the floor type. B. Whisker plot of the 2nd principal component values. The significant difference between the two groups observed in the DGGE-based PCA-plot is confirmed (p<0.01***).
Figure 4
Figure 4. Time spent in each of the three Tripletest compartments and risk assessments.
No significant differences were observed between control mice and grid floor housed mice in the overall time spent in the three compartments. Some significant changes were observed within each group. ”IZ”: time spent in IZ of total test time, “DC”: time spent in DC of total test time, “Entries CA”: number of entries into CA from OF, LDB or CA, “RAOA”: risk assessment OA, “RAOF”: risk assessment OF. “OF/total test time”: time spent in Open Field of total test time, “EPM”/total test time”: time spent in Elevated Plus Maze of total test time, “LDC/total test time”: time spent in Light (LC) or Dark Compartment (DC) of total test time, “RAOA, RAL, RAOF”: time spent risk assessing Open Arms, Light Compartment and Open Field, respectively.
Figure 5
Figure 5. Burrowing.
Scatter plots of amount for control mice (A) and mice housed on grid floor (B) (g, mean and SD). No significant difference was found between the groups. Within the groups, there was a significant difference from baseline to end, which differed between the groups with a mean of 10.77 g removed wood chips for the control mice (p<0.05) compared to 19.64 g for grid floor housed mice (p<0.01).
Figure 6
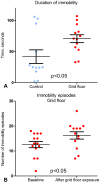
Figure 6. TST results.
End results from three mice were not obtained, as they learned to master tail climbing. A. End results for immobility duration for control mice and grid floor housed mice. There was a significant difference between the groups in total duration of immobility (p<0.05) (s, mean and SD). B. Within-group comparison from baseline to end of grid floor housed mice. There was a significant increase in the number of immobility episodes (p<0.05) (number of episodes, mean and SD).
Figure 7
Figure 7. Overview of Tripletest construction.
The Open Field is connected to the closed arm of the Elevated Plus Maze with a 7×7 cm opening and a similar passage connects the other closed arm of the Elevated Plus Maze to the Light/Dark Box. The whole system is elevated 45 cm from the floor.

Similar articles

Cited by

References

    1. Vael C, Desager K (2010) The importance of the development of the intestinal microbiota in infancy. Curr Opin in Pediatr 21 6: 794–800. - PubMed
    1. Fujimura KE, Slusher NA, Cabana MD, Lynch SV (2010) Role of the gut microbiota in defining human health. Expert Rev Anti Infect Ther 8: 435–54. - PMC - PubMed
    1. Elenkov IJ, Chrousos GP (1999) Stress Hormones, Th1/Th2 patterns, Pro/Anti-inflammatory Cytokines and Susceptibility to Disease. Trends Endocrin Met 10 9: 359–368. - PubMed
    1. Collins SM, Bercik P (2009) The relationship between intestinal microbiota and the central nervous system in normal gastrointestinal function and disease. Gastroenterology 136 6: 2003–2014. - PubMed
    1. Neufeld KA, Foster JA (2009) Effects of gut microbiota on the brain: implications for psychiatry. J Psychiatr Neurosci 34 3: 230–31. - PMC - PubMed

Publication types