. 2012;7(10):e46858.
doi: 10.1371/journal.pone.0046858. Epub 2012 Oct 8.

Isolation and characterization of tumor cells from the ascites of ovarian cancer patients: molecular phenotype of chemoresistant ovarian tumors

Affiliations

Isolation and characterization of tumor cells from the ascites of ovarian cancer patients: molecular phenotype of chemoresistant ovarian tumors

Ardian Latifi et al. PLoS One. 2012.

Abstract

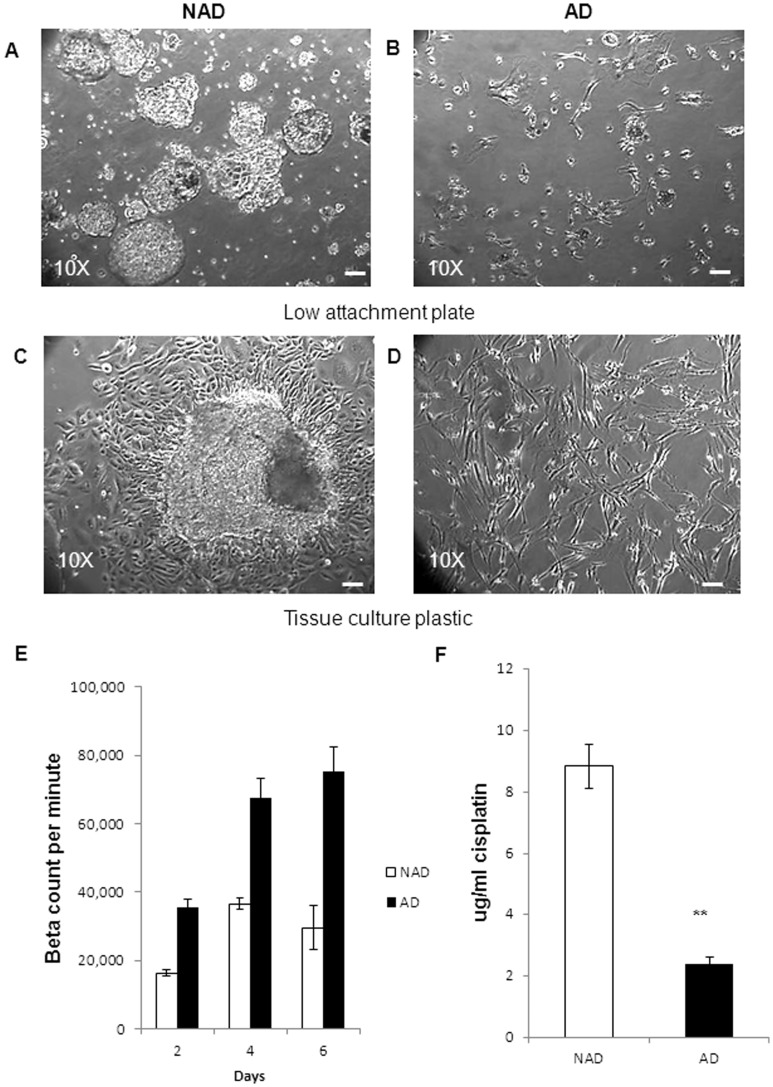
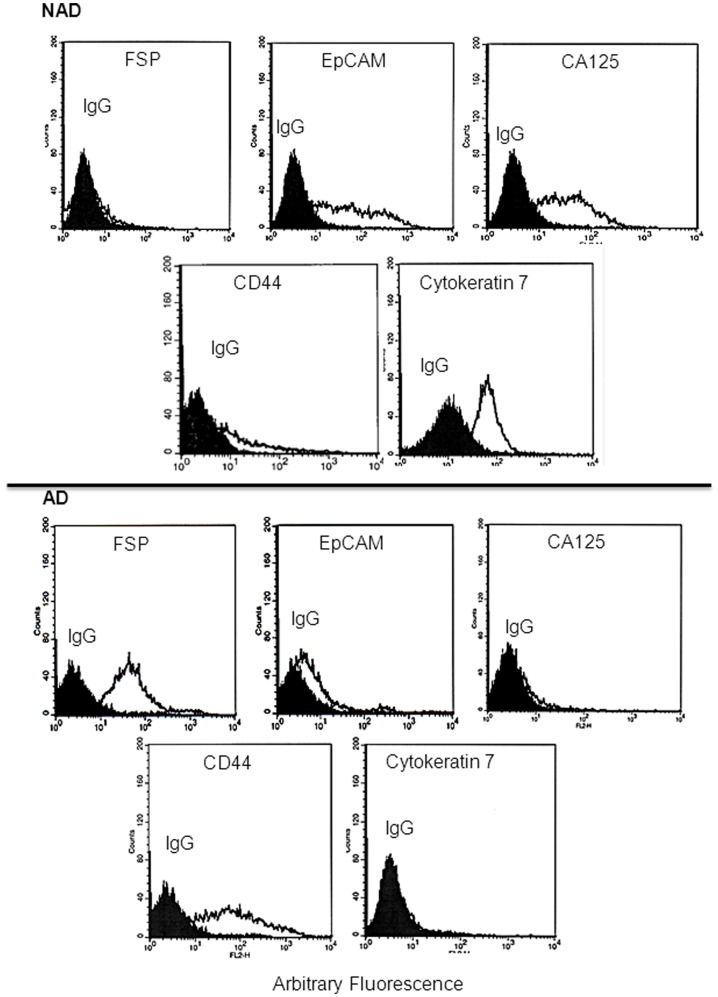
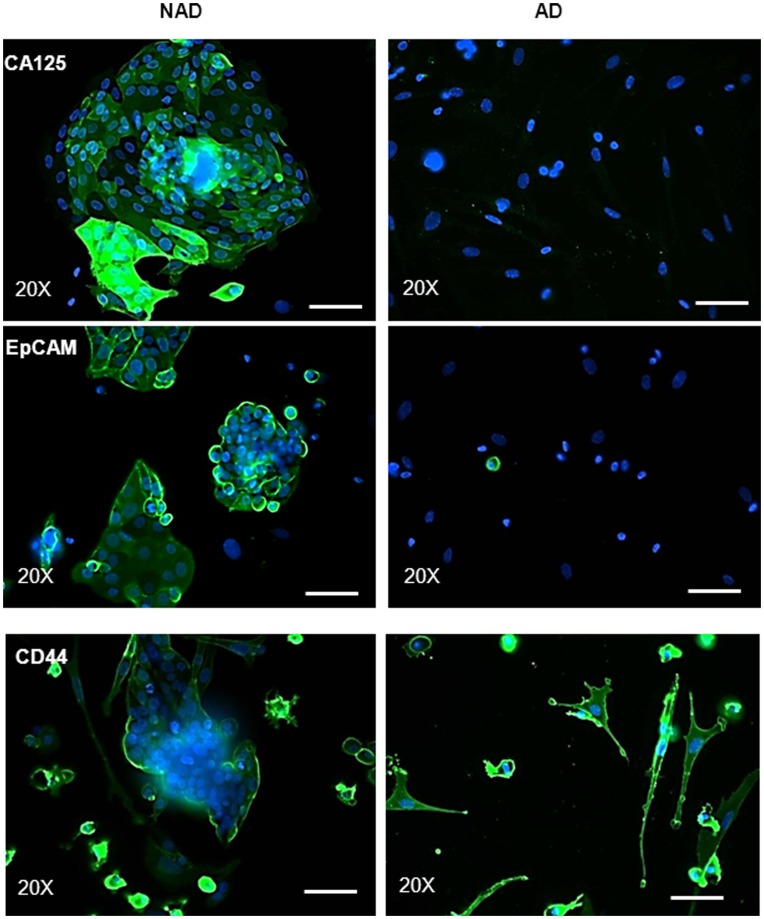
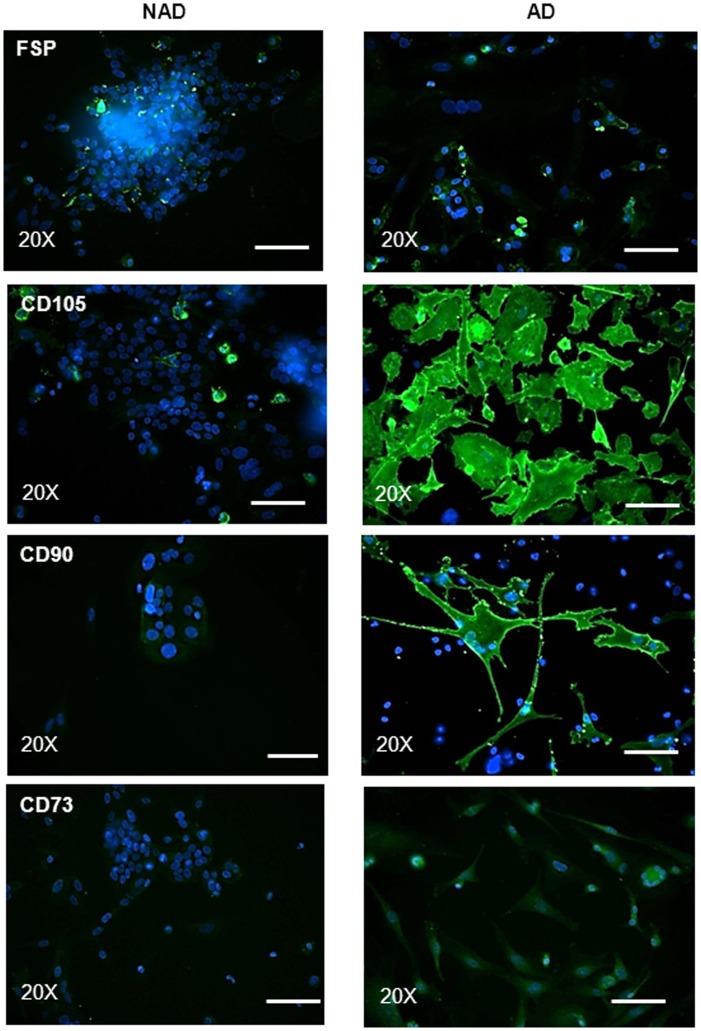
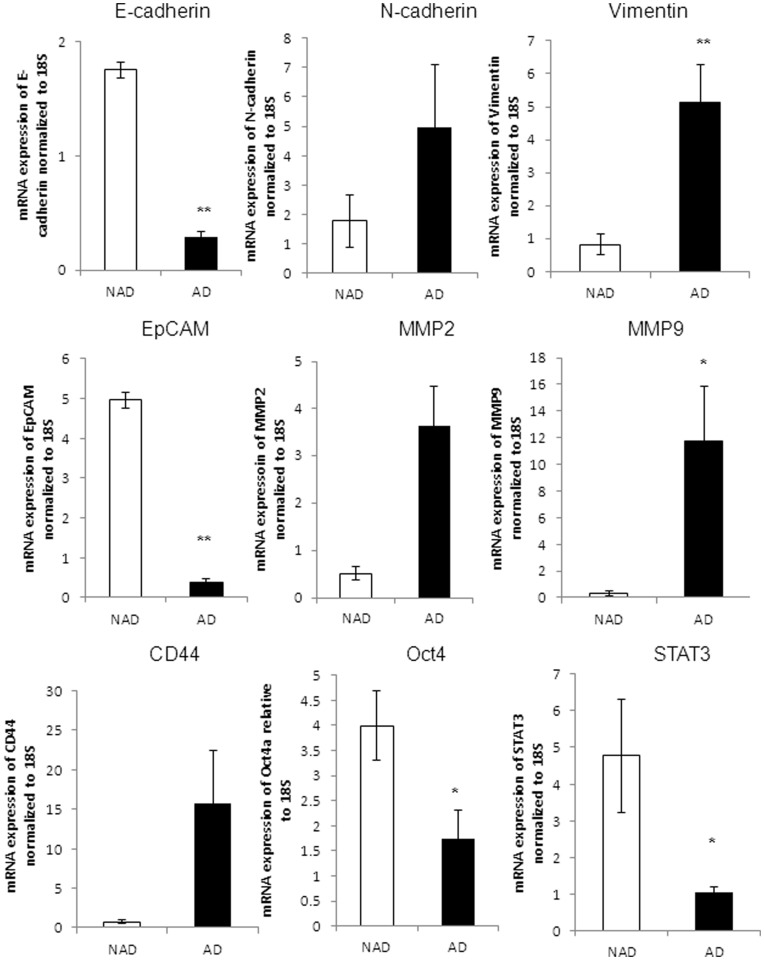
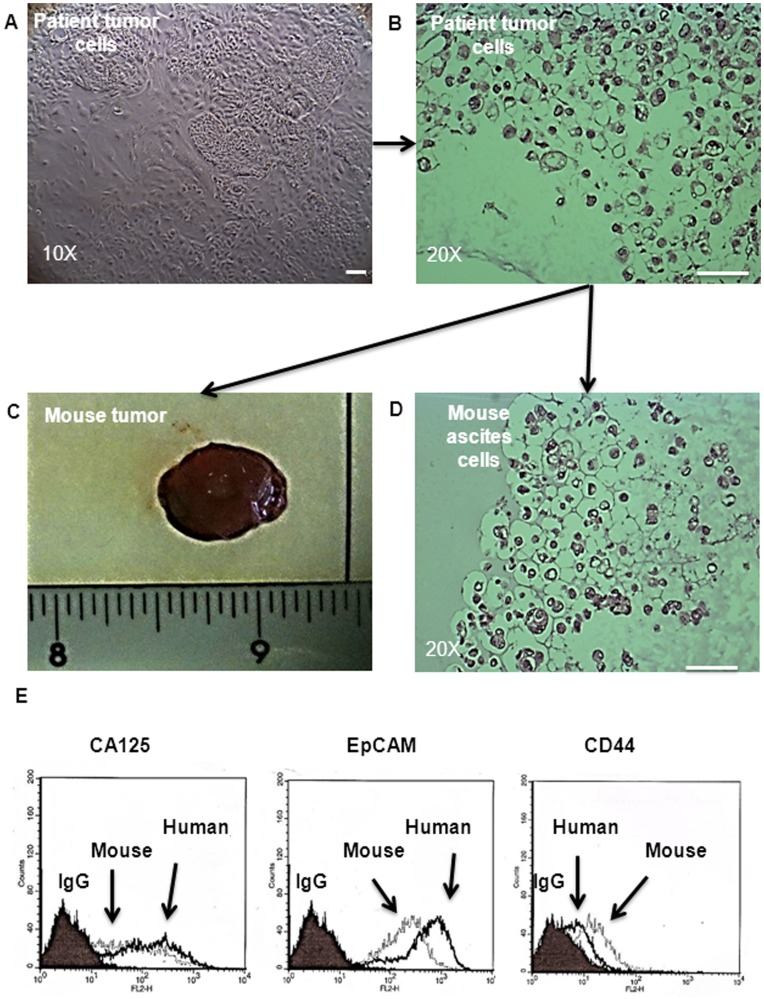
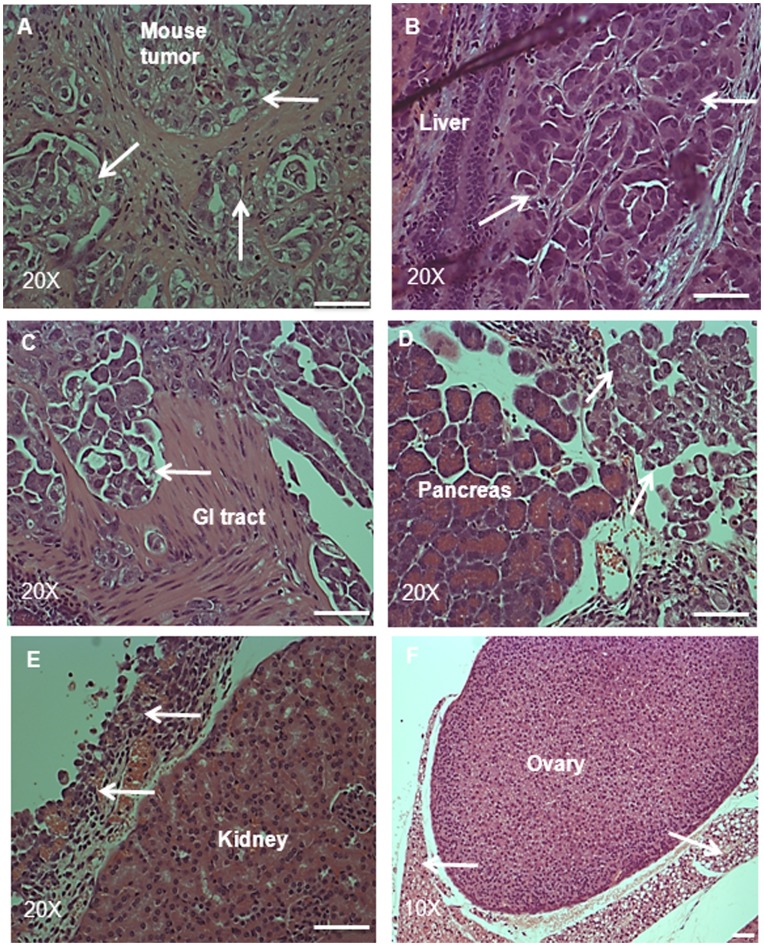
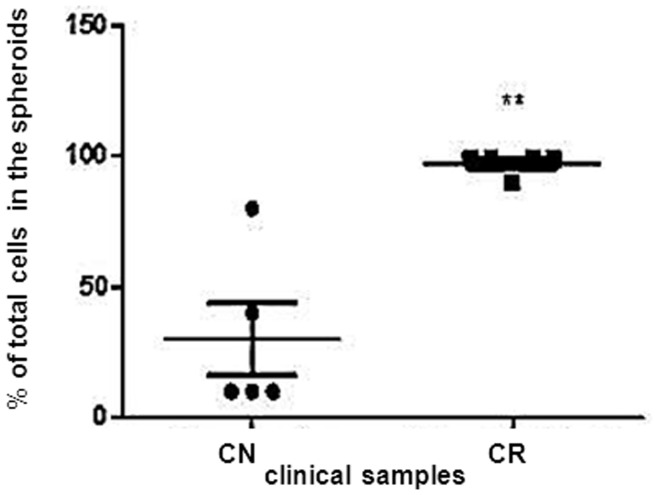
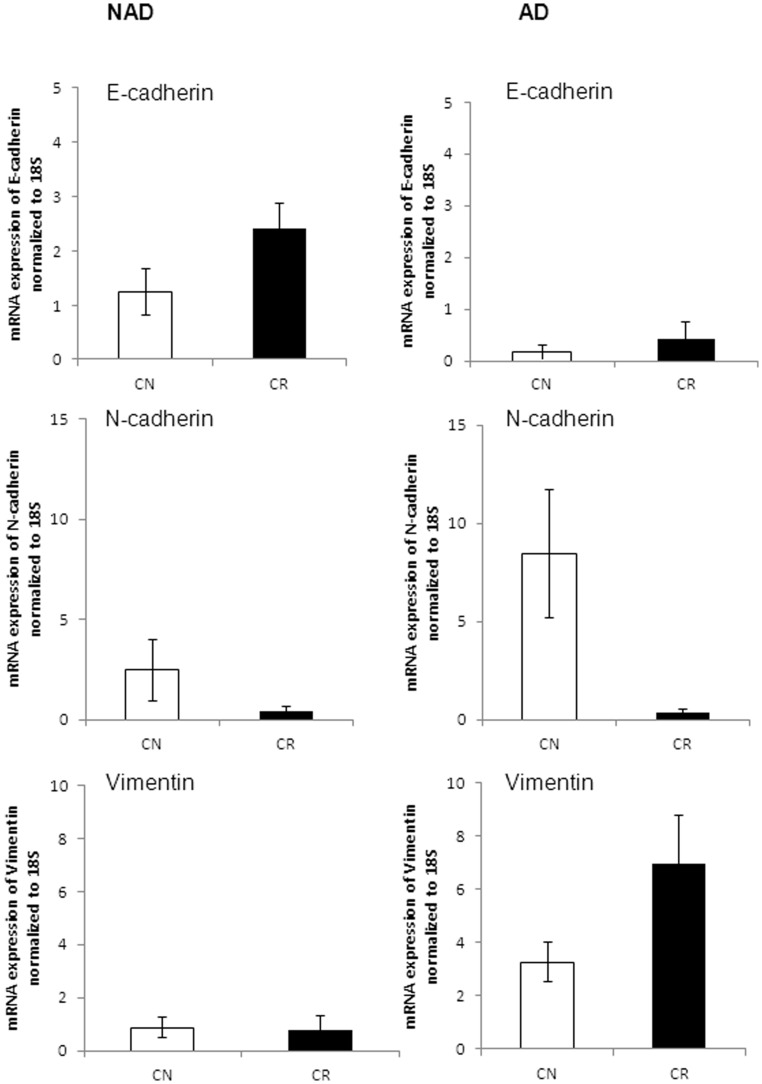
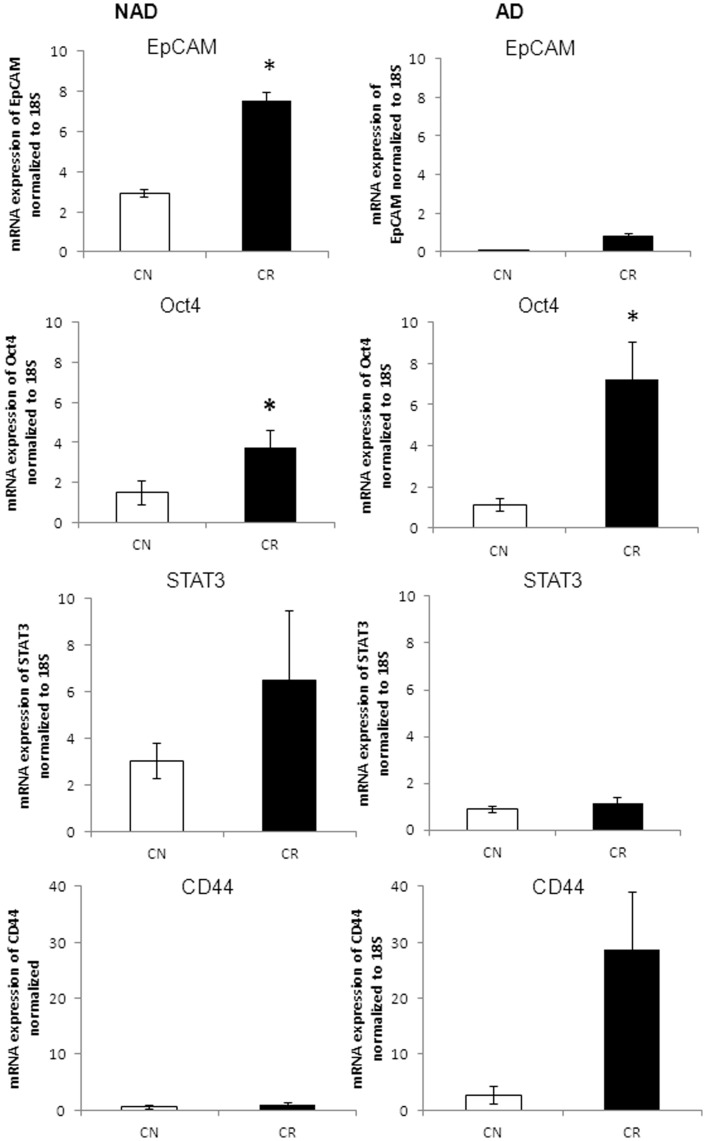
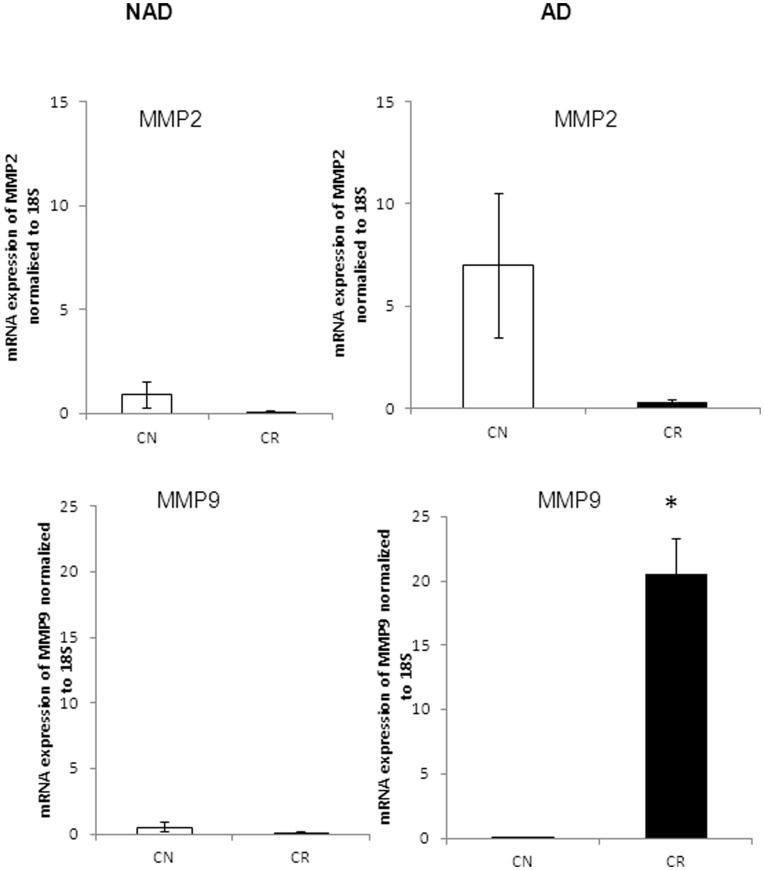
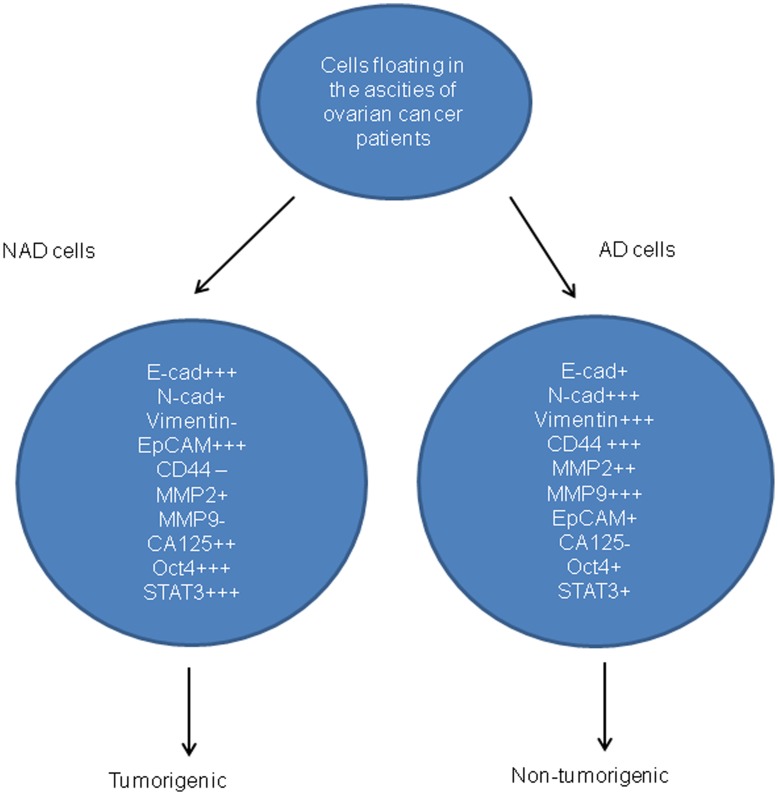
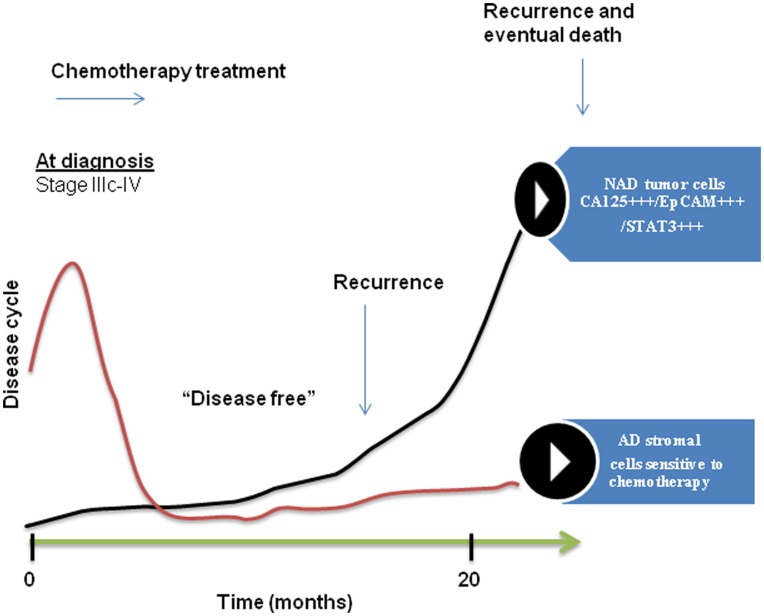
Tumor cells in ascites are a major source of disease recurrence in ovarian cancer patients. In an attempt to identify and profile the population of ascites cells obtained from ovarian cancer patients, a novel method was developed to separate adherent (AD) and non-adherent (NAD) cells in culture. Twenty-five patients were recruited to this study; 11 chemonaive (CN) and 14 chemoresistant (CR). AD cells from both CN and CR patients exhibited mesenchymal morphology with an antigen profile of mesenchymal stem cells and fibroblasts. Conversely, NAD cells had an epithelial morphology with enhanced expression of cancer antigen 125 (CA125), epithelial cell adhesion molecule (EpCAM) and cytokeratin 7. NAD cells developed infiltrating tumors and ascites within 12-14 weeks after intraperitoneal (i.p.) injections into nude mice, whereas AD cells remained non-tumorigenic for up to 20 weeks. Subsequent comparison of selective epithelial, mesenchymal and cancer stem cell (CSC) markers between AD and NAD populations of CN and CR patients demonstrated an enhanced trend in mRNA expression of E-cadherin, EpCAM, STAT3 and Oct4 in the NAD population of CR patients. A similar trend of enhanced mRNA expression of CD44, MMP9 and Oct4 was observed in the AD population of CR patients. Hence, using a novel purification method we demonstrate for the first time a distinct separation of ascites cells into epithelial tumorigenic and mesenchymal non-tumorigenic populations. We also demonstrate that cells from the ascites of CR patients are predominantly epithelial and show a trend towards increased mRNA expression of genes associated with CSCs, compared to cells isolated from the ascites of CN patients. As the tumor cells in the ascites of ovarian cancer patients play a dominant role in disease recurrence, a thorough understanding of the biology of the ascites microenvironment from CR and CN patients is essential for effective therapeutic interventions.


Conflict of interest statement

Competing Interests: The authors have declared that no competing interests exist.

Figures

Figure 1
Figure 1. Morphological features, proliferation and cisplatin sensitivity of NAD and AD cells.
(A) NAD spheroids and (B) AD cells were seeded on low attachment plates immediately after collection. Morphological features of (C) NAD spheroid and (D) AD cells on tissue culture plastic after 24 h following seeding. Images were assessed by phase contrast microscopy. Magnification was 100×, scale bar = 50 µm. The images are representative of (n = 25) samples. (E) [3H]-thymidine uptake in AD cells and in cells dispersed from spheroids was performed as described in Methods and Materials. The graph is a representation of one ascites sample performed in triplicate. (F) Effect of cisplatin on the proliferation {[3H]-thymidine uptake} of NAD and AD cells obtained from the ascites of ovarian cancer patients. The graph is a representation of three independent experiments, performed on three independent NAD and AD samples in triplicate. Significantly different between AD versus NAD cells, **p<0.01.
Figure 2
Figure 2. Expression of surface markers on NAD and AD cells by flow cytometry.
Purified cells from the ascites of CN (n = 11) and CR (n = 14) ovarian cancer patients were incubated with either control IgG or relevant primary antibodies against the respective antigens followed by secondary phycoerythrin conjugated antibody. Results are representative of (n = 25) independent samples. The filled histogram in each figure represents control IgG, black lines indicate protein expression in respective cells.
Figure 3
Figure 3. Expression and immunolocalization of CA125 and CSC markers by immunofluorescence.
Purified NAD and AD cells were evaluated by immunofluorescence using mouse monoclonal antibody (green) as described in the Methods and Materials. Cellular staining was visualized using the secondary Alexa 488 (green) fluorescent labeled antibody, and nuclei were detected by DAPI (blue) staining. Images are representative of three independent samples. Magnification was 200×; scale bar = 50 µm.
Figure 4
Figure 4. Expression and immunolocalization of MSC markers by immunofluorescence.
Immunofluorescence study was performed on purified NAD and AD cells as described in Figure 3. Images are representative of three independent samples. Magnification was 200×; scale bar = 50 µm.
Figure 5
Figure 5. mRNA expression of epithelial, mesenchymal and CSC markers in isolated ascites cells.
qPCR was performed on purified NAD and AD populations as described in the Methods and Materials. Yields were converted to femtograms based on the standard curve for each PCR product, and the resultant mRNA levels were normalized to the 18S mRNA level per sample. The data were calculated from the results of eight independent samples assessed in triplicate. Significantly different in AD versus NAD cells *(p<0.05) and **(p<0.01).
Figure 6
Figure 6. Tumorigenic properties of NAD and AD cells purified from the ascites of CR patients.
(A) A phase contrast microscope image of NAD cells adhered to plastic before preparing the cell suspension for i.p. injection; (B) H and E staining of agarose embedded patient sample before injection; (C) image of solid tumor obtained from a mouse fourteen weeks after i.p. injection of NAD cells (5×10⁶); (D) H and E staining of mouse ascites NAD cells embedded on agarose; (E) Flow cytometric comparison of the expression of CA125, EpCAM and CD44 between the patient’s and mouse ascites cells. Results are representative of two independent samples. The filled histogram in each figure represents control IgG, black lines indicate protein expression in human cells, broken lines indicate the expression of the protein in mouse ascites cells.
Figure 7
Figure 7. H and E staining of tumor and the associated infiltrated organs in a mouse.
Histological images of (A) tumor, (B) liver, (C) GI tract and (D) pancreas from a mouse injected i.p. with NAD cells (5×10⁶). Arrows in the tumor (A) indicate pockets of tumor cells surrounded by connective tissue. (B–D) arrows indicate tumor cells invading the respective organs. H and E staining of (E) kidney and (F) ovary from a mouse injected with NAD cells (5×10⁶). Arrows indicate tumor cells surrounding the organs without invasion. Magnification was 200× for all, except ovary which had magnification of 100×, scale bar = 50 µm.
Figure 8
Figure 8. Cellular assessment of NAD and AD cells obtained from CN and CR patients.
Percentage distribution of total cells in the NAD and AD populations of ascites of CN (n = 5) and CR (n = 5) patients was determined by Trypan Blue Exclusion assay. Results are mean±SEM of five independent samples assessed in triplicate. Significantly different in CR versus CN samples, **(p<0.01).
Figure 9
Figure 9. mRNA expression of selective representative epithelial/mesenchymal markers in isolated cells obtained from CN and CR patients.
qPCR was performed as described in the Methods and Materials on the purified NAD and AD populations of cells isolated from the ascites of CN (n = 4) and CR (n = 4) ascites samples. Results are expressed as described in Figure 5 for four independent samples assessed in triplicate.
Figure 10
Figure 10. mRNA expression of selective representative CSC markers in purified ascites cells isolated from CN and CR patients.
qPCR was performed as described in Figure 9 on the purified NAD and AD populations of cells isolated from CN and CR ascites samples. Results are expressed as described in Figure 9. Significantly different in CR versus CN samples, *(p<0.05).
Figure 11
Figure 11. mRNA expression of MMP2 and MMP9 in purified cells from CN and CR patients.
qPCR was performed on isolated NAD and AD cells as described in Figure 9. Results are expressed as described in Figure 9. Significantly different in CR versus CN samples, *(p<0.05).
Figure 12
Figure 12. Distribution of markers in isolated cells obtained from the ascites of ovarian cancer patients.
The antigens have been scored as high expression (+++), moderate expression (++), low expression (+), and no expression ().
Figure 13
Figure 13. A model of tumor cell progression in the ascites of ovarian cancer patients post-chemotherapy.
Most ovarian cancer patients at diagnosis (stage IIIc/IV) present with ascites (CN) which consists of fibroblast-like stromal cells and a very few tumor cells. The majority of these patients (∼80%) after surgery and first line of chemotherapy return with recurrent cancer associated with ascites (CR). During the course of chemotherapy treatment and subsequent relapses, the percentage of stromal cells in the ascites is gradually decreased and the patient with recurrent cancer presents with ascites that consists mostly of CA125+++/EpCAM+++/STAT3+++chemoresistant epithelial NAD tumor cells. These CA125+++/EpCAM+++/STAT3+++ rich tumor cells are the eventual source of extraovarian peritoneal adhesions. These adhesions are the ultimate cause of patient mortality.

References

    1. Jemal A, Siegel R, Ward E, Hao Y, Xu J, et al. (2009) Cancer statistics, 2009. CA Cancer J Clin 59: 225–249. - PubMed
    1. Kuhn E, Kurman RJ, Shih IM (2012) Ovarian Cancer Is an Imported Disease: Fact or Fiction? Curr Obstet Gynecol Rep 1: 1–9. - PMC - PubMed
    1. Lengyel E (2010) Ovarian cancer development and metastasis. Am J Pathol 177: 1053–1064. - PMC - PubMed
    1. Ozols RF (2006) Systemic therapy for ovarian cancer: current status and new treatments. Semin Oncol 33: S3–11. - PubMed
    1. Wang Z, Li Y, Kong D, Banerjee S, Ahmad A, et al. (2009) Acquisition of epithelial-mesenchymal transition phenotype of gemcitabine-resistant pancreatic cancer cells is linked with activation of the notch signaling pathway. Cancer Res 69: 2400–2407. - PMC - PubMed

Publication types

MeSH terms