. 2012:2:722.
doi: 10.1038/srep00722. Epub 2012 Oct 10.

Manipulating Mn-Mgk cation complexes to control the charge- and spin-state of Mn in GaN

Affiliations

Manipulating Mn-Mgk cation complexes to control the charge- and spin-state of Mn in GaN

Thibaut Devillers et al. Sci Rep. 2012.

Abstract

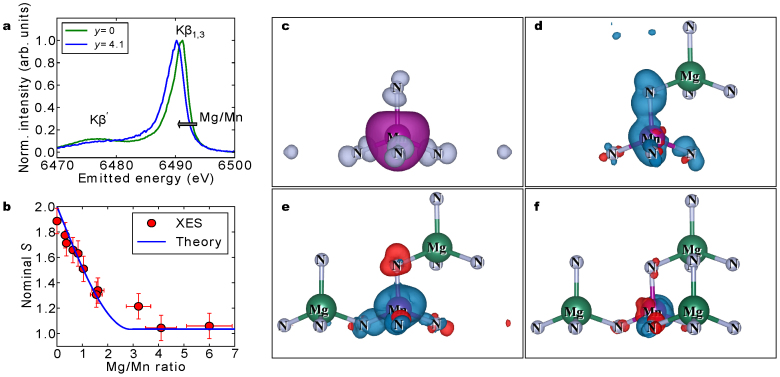
Owing to the variety of possible charge and spin states and to the different ways of coupling to the environment, paramagnetic centres in wide band-gap semiconductors and insulators exhibit a strikingly rich spectrum of properties and functionalities, exploited in commercial light emitters and proposed for applications in quantum information. Here we demonstrate, by combining synchrotron techniques with magnetic, optical and ab initio studies, that the codoping of GaN:Mn with Mg allows to control the Mn(n+) charge and spin state in the range 3≤n≤5 and 2≥S≥1. According to our results, this outstanding degree of tunability arises from the formation of hitherto concealed cation complexes Mn-Mg(k), where the number of ligands k is pre-defined by fabrication conditions. The properties of these complexes allow to extend towards the infrared the already remarkable optical capabilities of nitrides, open to solotronics functionalities, and generally represent a fresh perspective for magnetic semiconductors.


Figures

Figure 1
Figure 1. Mn–Mgk complexes predicted by theory and experimental demonstration by EXAFS.
(a) most stable Mn–Mgk complexes (k = 1,2 and 3) and their pairing energies – computed by DFT within the GGA+U approximation – relatively to the previous Mn-Mgk–1 complex. A gray arrow indicates the [0001] direction, i.e. the GaN c-axis; (b) number of Mg atoms seen by Mn in the first cation coordination sphere (nMg), extracted from EXAFS measurements and DFT predictions; (c) schematic representation of a Mn–Mg complex; (d) detailed values of the bond lengths for different complexes, calculated by DFT; (e) average Mn-N bond length (dMn–N) as a function of the Mg/Mn ratio, from EXAFS analysis and DFT calculations.
Figure 2
Figure 2. Evolution of the Mn spin state.
(a) non-resonant XES for GaN:Mn samples with and without Mg; (b) evolution of the nominal spin value with the ratio between Mg and Mn concentration, extracted from the analysis of XES spectra and calculated via DFT; (c) computed spin polarization density [Δρ = ρ(↑) − ρ(↓)] for MnGa in wurtzite (wz)-GaN. The positive and negative spin polarizations are represented by violet and grey colours, respectively; (d–f) difference ρkρk–1, between the spin polarizations of the Mn–Mgk complexes, with k = 1, 2 and 3. The red and blue colours represent positive and negative values, respectively. The blue colour in (d) indicates the enhanced delocalization of spin polarization in Mn-Mg, whereas the red colour in (e) and (f) points to a gradual shift of the spin density to Mn in Mn-Mg2 and then in Mn-Mg3. In all plots the contour value is set to 0.005 corresponding to about 2 × 10⁻⁵ µBÅ−3.
Figure 3
Figure 3. Magnetism of Mn–Mgk complexes.
Magnetic anisotropy energy density as a function of y measured by SQUID magnetometry, and calculated assuming that it originates from Mn without Mg in the first cation coordination sphere. Inset: normalized magnetization curves MH of GaN:Mn containing 0.4% of Mn without and with Mg codoping (left and right panel, respectively) measured at 1.85 K.
Figure 4
Figure 4. Infrared photoluminescence of GaN:(Mn,Mg) samples.
(a) evolution of the PL spectra (excited with a 442 nm (2.8 eV) laser) as a function of the y ratio, measured at 2 K (a multiplying factor of 1.4 has been applied between consecutive spectra for clarity); (b) integrated PL intensity normalized by the Mn concentration and sample thickness as a function of the y ratio (red circles, left scale) and evolution of the fraction of different complexes, calculated as a function of y (lines, right scale); (c) evolution of the PL spectra with temperature, for a sample with y = 4.1; the background at 296 K is also included. A factor of 1.4 has been applied between consecutive spectra for clarity. (d) evolution of the integrated PL intensity as a function of the inverse temperature, normalized to the value at T = 5 K; the line is a guide for the eye. Inset: levels relevant to PL as discussed in the Supplementary Information.

References

    1. Morkoç H. Handbook of Nitride Semiconductors and Devices: GaN-based Optical and Electronic Devices, vol. 3 (Wiley-VCH, 2009).
    1. Sato K. et al. First-principles theory of dilute magnetic semiconductors. Rev. Mod. Phys. 82, 1633–1690 (2010).
    1. Bonanni A. & Dietl T. A story of high-temperature ferromagnetism in semiconductors. Chem. Soc. Rev. 39, 528–539 (2010). - PubMed
    1. Jamet M. et al. High-Curie-temperature ferromagnetism in self-organized Ge1–xMnx nanocolumns. Nat. Mater. 5, 653–659 (2006). - PubMed
    1. Yokoyama M., Yamaguchi H., Ogawa T. & Tanaka M. Zinc-blende-type MnAs nanoclusters embedded in GaAs. J. Appl. Phys. 97, 10D317 (2005).

Publication types