. 2012 Oct 11:12:188.
doi: 10.1186/1471-2229-12-188.

The SbSOS1 gene from the extreme halophyte Salicornia brachiata enhances Na(+) loading in xylem and confers salt tolerance in transgenic tobacco

Affiliations

The SbSOS1 gene from the extreme halophyte Salicornia brachiata enhances Na(+) loading in xylem and confers salt tolerance in transgenic tobacco

Narendra Singh Yadav et al. BMC Plant Biol. .

Abstract

Background: Soil salinity adversely affects plant growth and development and disturbs intracellular ion homeostasis resulting cellular toxicity. The Salt Overly Sensitive 1 (SOS1) gene encodes a plasma membrane Na(+)/H(+) antiporter that plays an important role in imparting salt stress tolerance to plants. Here, we report the cloning and characterisation of the SbSOS1 gene from Salicornia brachiata, an extreme halophyte.

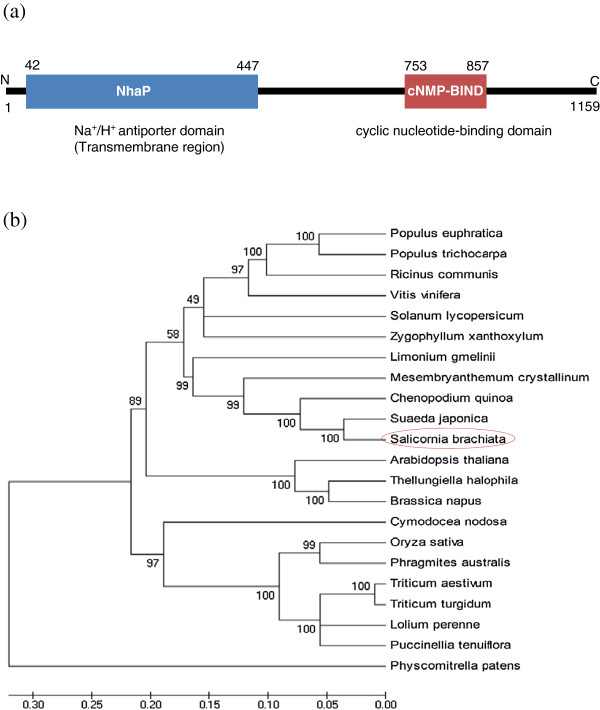
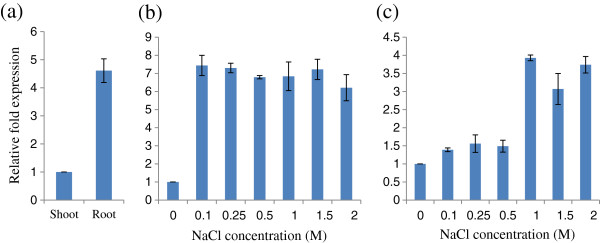
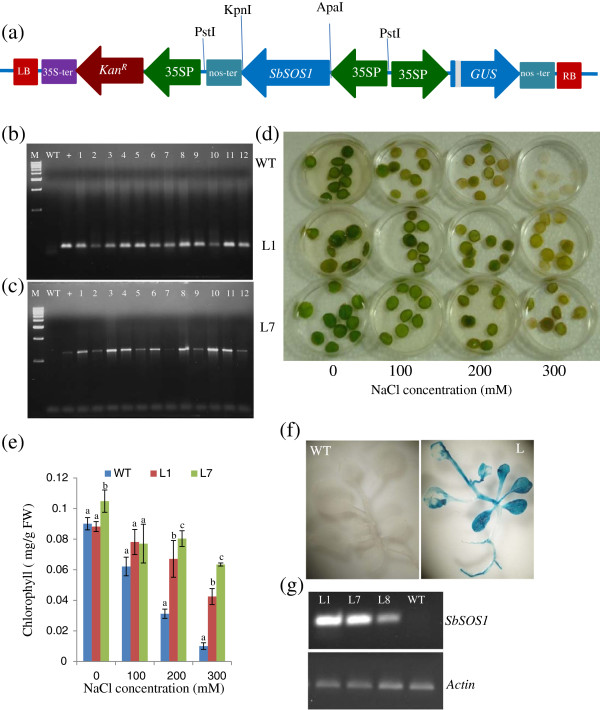
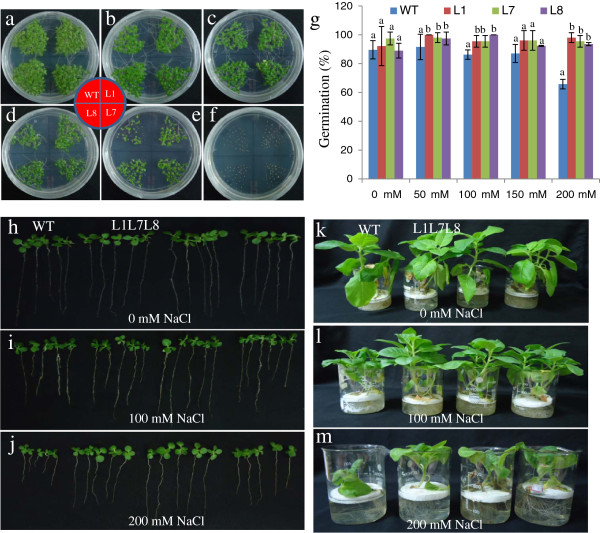
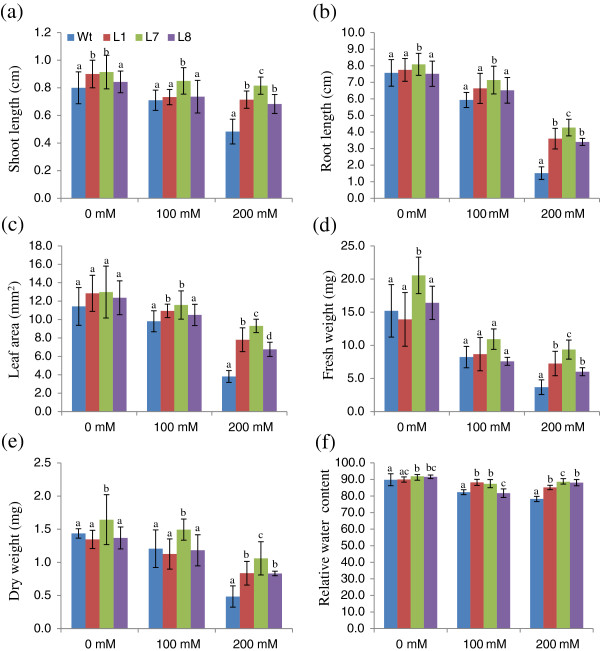
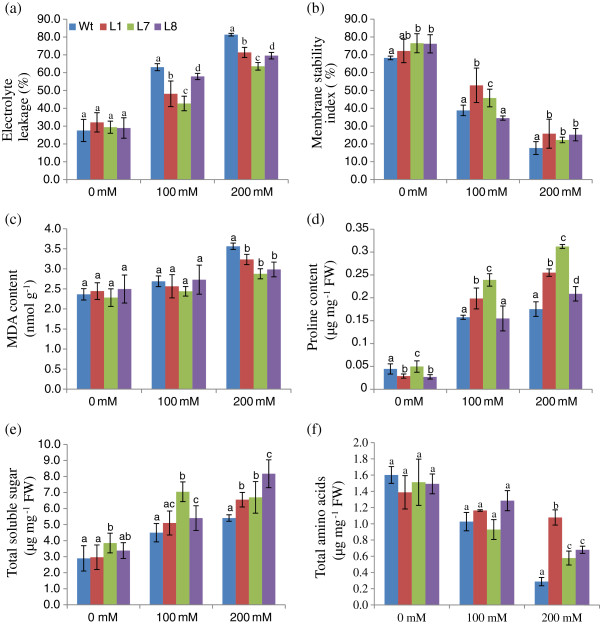
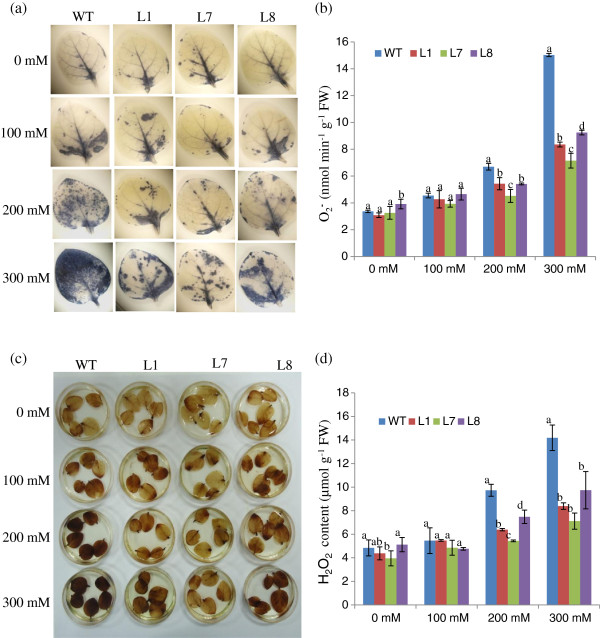
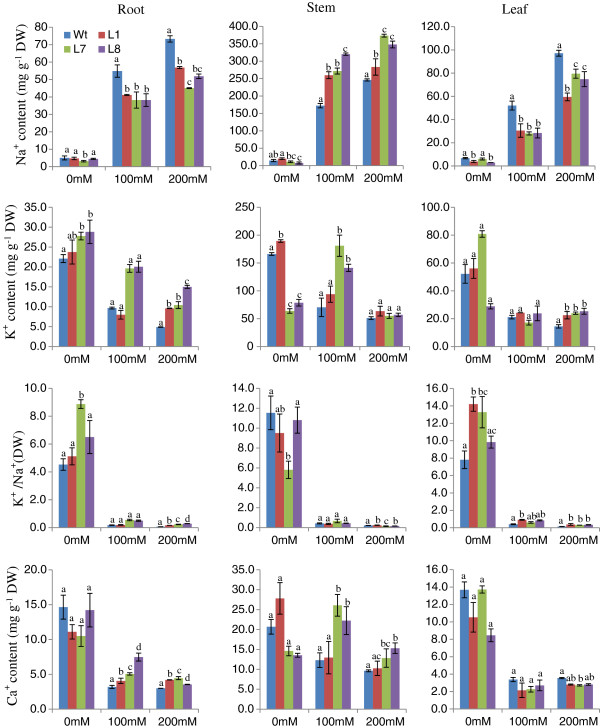
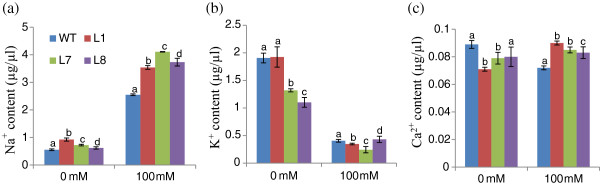
Results: The SbSOS1 gene is 3774 bp long and encodes a protein of 1159 amino acids. SbSOS1 exhibited a greater level of constitutive expression in roots than in shoots and was further increased by salt stress. Overexpressing the S. brachiata SbSOS1 gene in tobacco conferred high salt tolerance, promoted seed germination and increased root length, shoot length, leaf area, fresh weight, dry weight, relative water content (RWC), chlorophyll, K(+)/Na(+) ratio, membrane stability index, soluble sugar, proline and amino acid content relative to wild type (WT) plants. Transgenic plants exhibited reductions in electrolyte leakage, reactive oxygen species (ROS) and MDA content in response to salt stress, which probably occurred because of reduced cytosolic Na(+) content and oxidative damage. At higher salt stress, transgenic tobacco plants exhibited reduced Na(+) content in root and leaf and higher concentrations in stem and xylem sap relative to WT, which suggests a role of SbSOS1 in Na(+) loading to xylem from root and leaf tissues. Transgenic lines also showed increased K(+) and Ca(2+) content in root tissue compared to WT, which reflect that SbSOS1 indirectly affects the other transporters activity.

Conclusions: Overexpression of SbSOS1 in tobacco conferred a high degree of salt tolerance, enhanced plant growth and altered physiological and biochemical parameters in response to salt stress. In addition to Na(+) efflux outside the plasma membrane, SbSOS1 also helps to maintain variable Na(+) content in different organs and also affect the other transporters activity indirectly. These results broaden the role of SbSOS1 in planta and suggest that this gene could be used to develop salt-tolerant transgenic crops.


Figures

Figure 1
Figure 1
(a) Schematic diagram showing the transmembrane domains and cyclic nucleotide-binding domain. N and C indicates N-terminal and C-terminal end of the SbSOS1, respectively. (b) The phylogenetic relationship of SbSOS1 with SOS1 from other plant species. The phylogenetic tree was constructed using MEGA ver. 4.0 and the bootstrap values were calculated from 100 replicates and are shown next to branches. The higher bootstrap value signifies resilience in the phylogenetic position of the protein. The scale bar indicates substitutions per site. The protein sequences used for construction of the phylogenetic tree are as follows: Suaeda japonica (BAE95196.1), Chenopodium quinoa (ACN66494.1), Mesembryanthemum crystallinum (ABN04858.1), Limonium gmelinii (ACF05808.1), Ricinus communis (XP_002521897.1), Populus trichocarpa (XP_002315837.1), Vitis vinifera (ACY03274.1), Populus euphratica (ABF60872.1), Zygophyllum xanthoxylum (ACZ57357.1), Solanum lycopersicum (BAL04564.1), Cymodocea nodosa (CAD20320.1), Phragmites australis (BAF41924.1), Oryza sativa Japonica (AAW33875.1), Triticum turgidum (ACB47885.1), Puccinellia tenuiflora (BAK23260.1), Triticum aestivum (CAX83738.1), Brassica napus (ACA50526.1), Lolium perenne (AAY42598.1), Arabidopsis thaliana (AF256224.1), Physcomitrella patens (CAM96566.1) and Thellungiella halophila (BAJ34642.1).
Figure 2
Figure 2
Real-time PCR analysis of the SbSOS1 gene in response to NaCl stress. (a) The relative expression of the SbSOS1 transcript in root tissue compared with shoot tissue at 0 mM NaCl, (b) the level of SbSOS1 transcript in root tissue at different NaCl concentrations (M), (c) SbSOS1 transcript expression in shoot tissue at different NaCl concentrations (M). The relative expression in root tissue (a) was calculated using the CT value of shoot tissue; in figures b and c, it was calculated using the values for 0 mM salt.
Figure 3
Figure 3
Characterisation of transgenic tobacco plants. (a) Schematic representation of the pCAMBIA2301 - 35S: SbSOS1 construct used to transform tobacco plants with the SbSOS1 gene. (b, c) Verification of transgenic lines via PCR analysis of the SbSOS1 gene with real-time PCR primers and gus-specific primers in T0 plants. (d) Leaf disc assay of WT and transgenic lines (L1 and L7) at different NaCl concentrations in T0 plants. (e) The graph represents the mean and standard deviation (SD) of chlorophyll content in leaf discs of WT and transgenic lines (L1 and L7) at different NaCl concentrations. (f) GUS assay of T1 plants showing positive GUS expression in the transgenic line and negative expression in WT plants. (g) Transcript levels of the SbSOS1 gene in transgenic lines (L1, L7 and L8) and WT T1 plants via semiquantitative RT-PCR.
Figure 4
Figure 4
Phenotypic comparison of the growth of WT and T1 transgenic lines (L1, L7 and L8) overexpressing the SbSOS1 gene. (a-f) Germination of seeds from transgenic lines (L1, L7 and L8) and WT plants in (a) 0 mM, (b) 50 mM, (c) 100 mM, (d) 150 mM, (e) 200 mM, and (f) 300 mM NaCl. (g) The graph represents the per cent germination of transgenic lines (L1, L7 and L8) and WT plants in 0 mM, 50 mM, 100 mM, 150 mM, and 200 mM NaCl after 15 days. (h-j) Growth comparison of transgenic lines (L1, L7 and L8) and WT T1 seedlings in (h) 0 mM, (i) 100 mM, and (j) 200 mM NaCl. (k-m) Growth of whole plants from transgenic lines (L1, L7 and L8) and WT plants at different NaCl concentrations: (k) 0 mM, (l) 100 mM and (m) 200 mM in hydroponic culture.
Figure 5
Figure 5
Comparison of growth parameters of 30-day-old seedlings from transgenic lines (L1, L7 and L8) and WT plants in 0 mM, 100 mM and 200 mM NaCl. (a) shoot length, (b) root length, (c) leaf area, (d) fresh weight, (e) dry weight and (f) relative water content (RWC).
Figure 6
Figure 6
Electrolyte leakage (a), membrane stability index (b), MDA (c), proline (d), total soluble sugar (e), and amino acid (d) contents of transgenic lines (L1, L7 and L8) and WT plants grown in hydroponic culture with 0 mM, 100 mM, and 200 mM NaCl.
Figure 7
Figure 7
In vivo localisation and quantification of O2and H2O2 in leaves of 35S-SbSOS1 and WT plants. (a) Localisation of O2 by NBT staining, (b) Quantification of O2 content, (c) Localisation of H2O2 by DAB staining and (d) Quantification of H2O2 content.
Figure 8
Figure 8
Na+, K+ and Ca2+ contents in root, shoot and leaf tissues of transgenic lines (L1, L7 and L8) and WT plants grown in hydroponic culture with 0 mM, 100 mM, and 200 mM NaCl. Individual K+/Na+ ratios of different plant organs are also shown in the graphs.
Figure 9
Figure 9
Na+, K+ and Ca2+ contents in xylem sap of transgenic lines (L1, L7 and L8) and WT plants grown in hydroponic culture with 0 and 100 mM NaCl.

Similar articles

Cited by

References

    1. Epstein E, Bloom AJ. Mineral nutrition of plants: principles and perspectives. 2. Sunderland, Massachusetts: Sinauer Associations; 2005. pp. 342–351.
    1. FAO. FAO land and plant nutrition management service. 2008. http://www.fao.org/ag/agl/agll/spush/
    1. Hasegava M, Bressan R, Pardo JM. The dawn of plant salt tolerance genetics. Trends Plant Sci. 2000;5:317–319. doi: 10.1016/S1360-1385(00)01692-7. - DOI - PubMed
    1. Wyn Jones RG, Pollard A. Encyclopedia of plant physiology. Berlin: Springer- Verlag; 1983.
    1. Hernández JA, Olmos E, Corpas FJ, Sevilla F, Del Río LA. Salt-induced oxidative stress in chloroplasts of pea plants. Plant Sci. 1995;105:151–167. doi: 10.1016/0168-9452(94)04047-8. - DOI

Publication types

MeSH terms

LinkOut - more resources