. 2012 Oct 11:12:156.
doi: 10.1186/1471-2288-12-156.

Combining directed acyclic graphs and the change-in-estimate procedure as a novel approach to adjustment-variable selection in epidemiology

Affiliations

Combining directed acyclic graphs and the change-in-estimate procedure as a novel approach to adjustment-variable selection in epidemiology

David Evans et al. BMC Med Res Methodol. .

Abstract

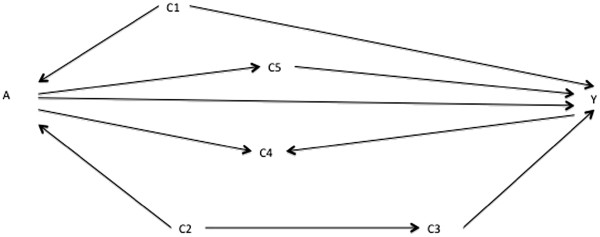
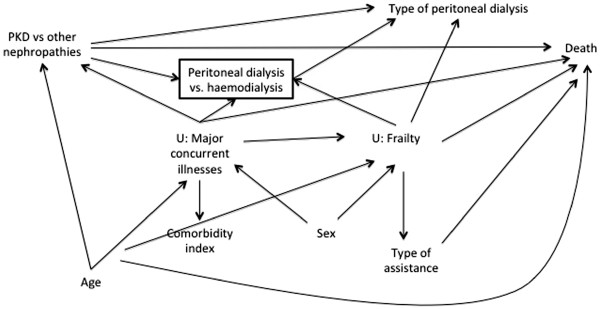
Background: Directed acyclic graphs (DAGs) are an effective means of presenting expert-knowledge assumptions when selecting adjustment variables in epidemiology, whereas the change-in-estimate procedure is a common statistics-based approach. As DAGs imply specific empirical relationships which can be explored by the change-in-estimate procedure, it should be possible to combine the two approaches. This paper proposes such an approach which aims to produce well-adjusted estimates for a given research question, based on plausible DAGs consistent with the data at hand, combining prior knowledge and standard regression methods.

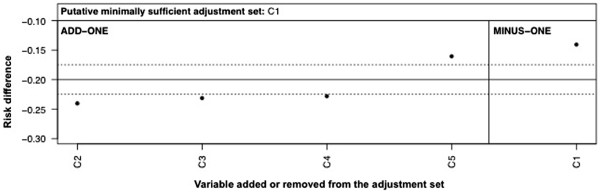
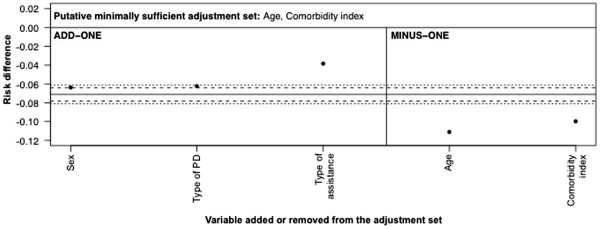
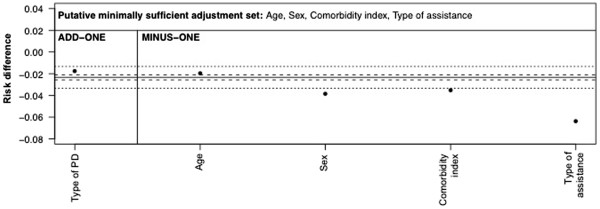
Methods: Based on the relationships laid out in a DAG, researchers can predict how a collapsible estimator (e.g. risk ratio or risk difference) for an effect of interest should change when adjusted on different variable sets. Implied and observed patterns can then be compared to detect inconsistencies and so guide adjustment-variable selection.

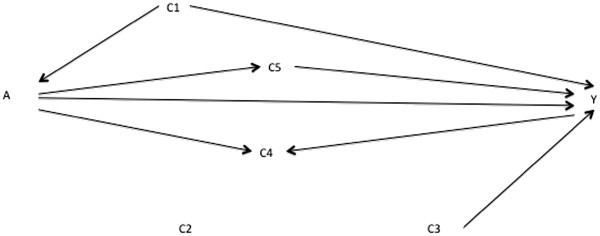
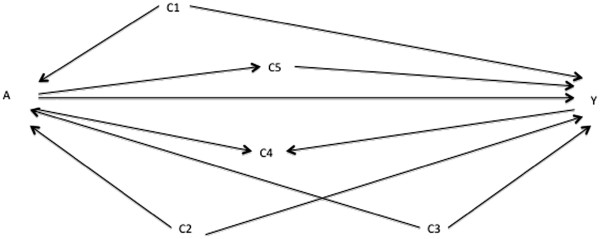
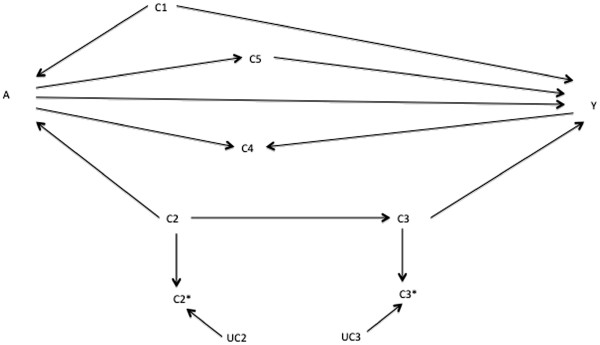
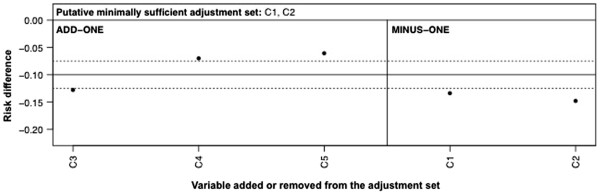
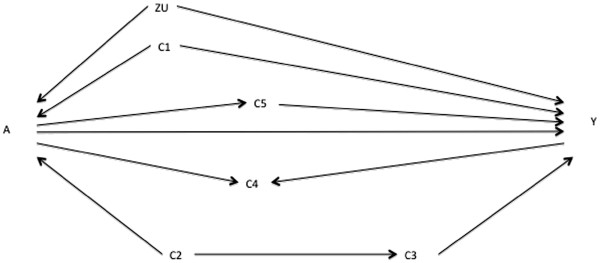
Results: The proposed approach involves i. drawing up a set of plausible background-knowledge DAGs; ii. starting with one of these DAGs as a working DAG, identifying a minimal variable set, S, sufficient to control for bias on the effect of interest; iii. estimating a collapsible estimator adjusted on S, then adjusted on S plus each variable not in S in turn ("add-one pattern") and then adjusted on the variables in S minus each of these variables in turn ("minus-one pattern"); iv. checking the observed add-one and minus-one patterns against the pattern implied by the working DAG and the other prior DAGs; v. reviewing the DAGs, if needed; and vi. presenting the initial and all final DAGs with estimates.

Conclusion: This approach to adjustment-variable selection combines background-knowledge and statistics-based approaches using methods already common in epidemiology and communicates assumptions and uncertainties in a standardized graphical format. It is probably best suited to areas where there is considerable background knowledge about plausible variable relationships. Researchers may use this approach as an additional tool for selecting adjustment variables when analyzing epidemiological data.


Figures

Figure 1
Figure 1
Directed acyclic graph showing putative relationships between variables A, Y, C1, C2, C3, C4, and C5.
Figure 2
Figure 2
Directed acyclic graph showing alternative putative relationships between variables A, Y, C1, C2, C3, C4, and C5.
Figure 3
Figure 3
Directed acyclic graph showing one set of alternative putative relationships between variables A, Y, C1, C2, C3, C4, and C5.
Figure 4
Figure 4
Directed acyclic graph showing another set of alternative putative relationships between variables A, Y, C1, C2, C3, C4, and C5.
Figure 5
Figure 5
Add-one and minus-one patterns for a starting adjustment-variable set of{C1}based on DAG in Figure2, taking the associations in the DAG in Figure1as the unknown best working DAG. The solid horizontal line is the RD estimate adjusted on the putative minimally sufficient set {C1}. The dashed horizontal lines are the pre-defined meaningful change thresholds in the RD estimate. The add-one section shows the RD upon adding each variable listed to the adjustment-variable set in turn. The minus-one section shows the RD upon removing each variable listed from the adjustment-variable set in turn.
Figure 6
Figure 6
Directed acyclic graph showing alternative putative relationships between variables A, Y, C1, C2, C3, C4, and C5 in which C2 and C3 are measured with error (measured variables are C2* and C3* and variables affecting their measurement are UC2 and UC3).
Figure 7
Figure 7
Add-one and minus-one patterns for a starting adjustment-variable set of {C1, C2} based on DAG in Figure1, taking the associations in the DAG in Figure6as the unknown best working DAG. Note that the variables listed as C2 and C3 are actually these variables measured with error, i.e. C2* and C3* in Figure 6. The solid horizontal line is the RD estimate adjusted on the putative minimally sufficient set {C1}. The dashed horizontal lines are the pre-defined meaningful change thresholds in the RD estimate. The add-one section shows the RD upon adding each variable listed to the adjustment-variable set in turn. The minus-one section shows the RD upon removing each variable listed from the adjustment-variable set in turn.
Figure 8
Figure 8
Directed acyclic graph showing alternative putative relationships between variables A, Y, C1, C2, C3, C4, C5, and an unmeasured variable ZU.
Figure 9
Figure 9
Directed acyclic graph showing prior assumptions about relationships between variables in the empirical example.
Figure 10
Figure 10
Directed acyclic graph showing prior uncertainty about variable relationships in the empirical example (absence of Type of Assistance -> Death arrow).
Figure 11
Figure 11
Directed acyclic graph showing prior uncertainty about variable relationships in the empirical example (absence of Sex -> Type of Assistance).
Figure 12
Figure 12
Directed acyclic graph showing prior uncertainty about variable relationships in the empirical example (showing Comorbidity index and Type of assistance as proxy variables for Major concurrent illnesses and Frailty, respectively).
Figure 13
Figure 13
Add-one and minus-one patterns for a adjustment-variable set of{Age, Comorbidity index}based on DAG in Figure9 The solid horizontal line is the RD estimate adjusted on this set. The dotted horizontal lines are the pre-defined meaningful change thresholds for an absolute change of ± 0.01 in the RD. The dashed horizontal lines are a relative change of ±10% of the starting RD. The add-one section shows the RD upon adding each variable listed to the adjustment-variable set in turn. The minus-one section shows the RD upon removing each variable listed from the adjustment-variable set in turn.
Figure 14
Figure 14
Add-one and minus-one patterns for a adjustment-variable set of {Age, Comorbidity index, Type of assistance, Sex} based on DAG in Figure12 The solid horizontal line is the RD estimate adjusted on this set. The dotted horizontal lines are the pre-defined meaningful change thresholds for an absolute change of ± 0.01 in the RD. The dashed horizontal lines are a relative change of ±10% of the starting RD. The add-one section shows the RD upon adding each variable listed to the adjustment-variable set in turn. The minus-one section shows the RD upon removing each variable listed from the adjustment-variable set in turn.

References

    1. Greenland S, Pearl J, Robins JM. Causal diagrams for epidemiologic research. Epidemiology. 1999;10:37–48. doi: 10.1097/00001648-199901000-00008. - DOI - PubMed
    1. Glymour M, Greenland S. Modern epidemiology. 3rd. Philadelphia, PA: Lippincott Williams &Wilkins; 2008. Causal diagrams; pp. 183–209.
    1. Pearl J. Causality: models, reasoning, and inference. 2nd. Cambridge: Cambridge University Press; 2009.
    1. Greenland S. Modeling and variable selection in epidemiologic analysis. Am J Public Health. 1989;79:340–349. doi: 10.2105/AJPH.79.3.340. - DOI - PMC - PubMed
    1. Vansteelandt S, Bekaert M, Claeskens G. On model selection and model misspecification in causal inference. Stat Methods Med Res. 2012;21:7–30. doi: 10.1177/0962280210387717. - DOI - PubMed