

Patterns and predictors of stress testing modality after percutaneous coronary stenting: data from the NCDR(®)
- PMID: 23058063
- PMCID: PMC3628616
- DOI: 10.1016/j.jcmg.2012.07.011
Patterns and predictors of stress testing modality after percutaneous coronary stenting: data from the NCDR(®)
Abstract
Objectives: We evaluated temporal trends and geographic variation in choice of stress testing modality after percutaneous coronary intervention (PCI), as well as associations between modality and procedure use after testing.
Background: Stress testing is frequently performed post-PCI, but the choices among available modalities (electrocardiography only, nuclear, or echocardiography; pharmacological or exercise stress) and consequences of such choices are not well characterized.
Methods: CathPCI Registry(®) data were linked with identifiable Medicare claims to capture stress testing use between 60 and 365 days post-PCI and procedures within 90 days after testing. Testing rates and modality used were modeled on the basis of patient, procedure, and PCI facility factors, calendar quarter, and Census Divisions using Poisson and logistic regression. Post-test procedure use was assessed using Gray's test.
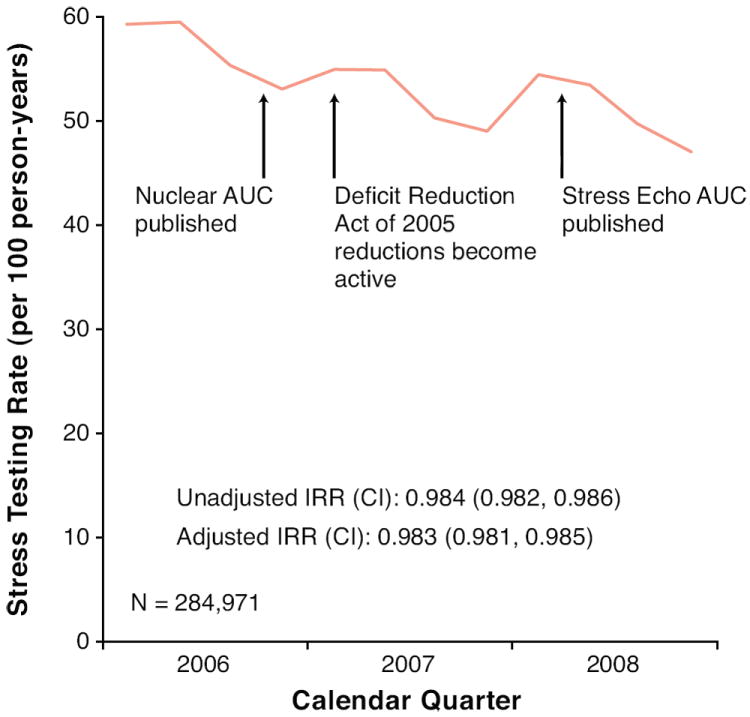
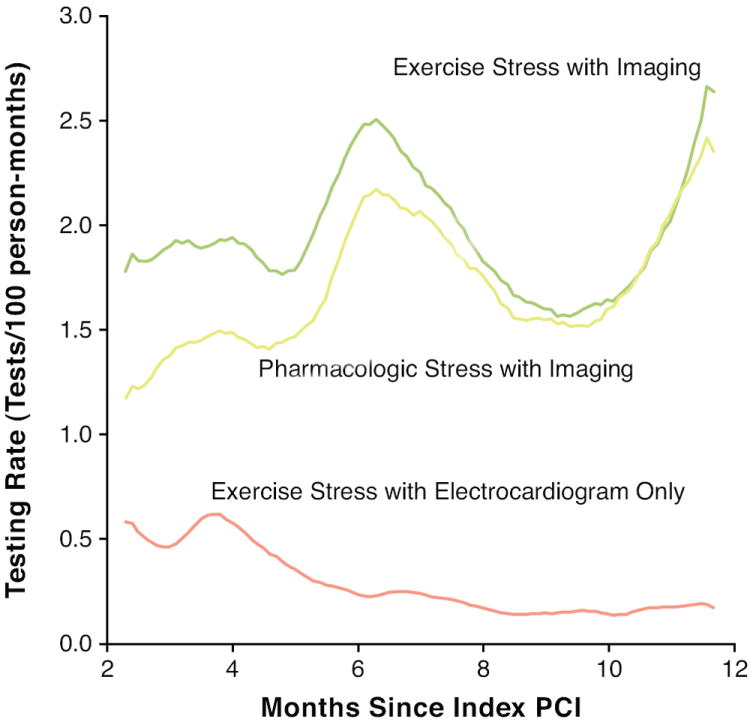
Results: Among 284,971 patients, the overall stress testing rate after PCI was 53.1 per 100 person-years. Testing rates declined from 59.3 in quarter 1 (2006) to 47.1 in quarter 4 (2008), but the relative use of modalities changed little. Among exercise testing recipients, adjusted proportions receiving electrocardiography-only testing varied from 6.8% to 22.8% across Census Divisions; and among exercise testing recipients having an imaging test, the proportion receiving echocardiography (versus nuclear) varied from 9.4% to 34.1%. Post-test procedure use varied among modalities; exercise electrocardiography-only testing was associated with more subsequent stress testing (13.7% vs. 2.9%; p < 0.001), but less catheterization (7.4% vs. 14.1%; p < 0.001) than imaging-based tests.
Conclusions: Modest reductions in stress testing after PCI occurring between 2006 and 2008 cannot be ascribed to trends in use of any single modality. Additional research should assess whether this trend represents better patient selection for testing or administrative policies (e.g., restricted access for patients with legitimate testing needs). Geographic variation in utilization of stress modalities and differences in downstream procedure use among modalities suggest a need to identify optimal use of the different test modalities in individual patients.
Copyright © 2012 American College of Cardiology Foundation. Published by Elsevier Inc. All rights reserved.
Figures


References
-
- Levin DC, Parker L, Intenzo CM, Sunshine JH. Recent rapid increase in utilization of radionuclide myocardial perfusion imaging and related procedures: 1996-1998 practice patterns. Radiology. 2002;222:144–8. - PubMed
-
- Hendel RC. Utilization management of cardiovascular imaging pre-certification and appropriateness. J Am Coll Cardiol Img. 2008;1:241–8. - PubMed
-
- Bove AA. President’s page: An arrow to the heart. J Am Coll Cardiol. 2009;54:2334–6. - PubMed
-
- Mitchell JM, Lagalia RR. Controlling the escalating use of advanced imaging: The role of radiology benefit management programs. Med Care Res Rev. 2009;66:339–51. - PubMed
Publication types
MeSH terms
Grants and funding
LinkOut - more resources
Full Text Sources
Medical
Miscellaneous
