. 2013 Mar;20(3):408-18.
doi: 10.1038/cdd.2012.130. Epub 2012 Oct 12.

HIF-1α downregulates miR-17/20a directly targeting p21 and STAT3: a role in myeloid leukemic cell differentiation

Affiliations

HIF-1α downregulates miR-17/20a directly targeting p21 and STAT3: a role in myeloid leukemic cell differentiation

M He et al. Cell Death Differ. 2013 Mar.

Abstract

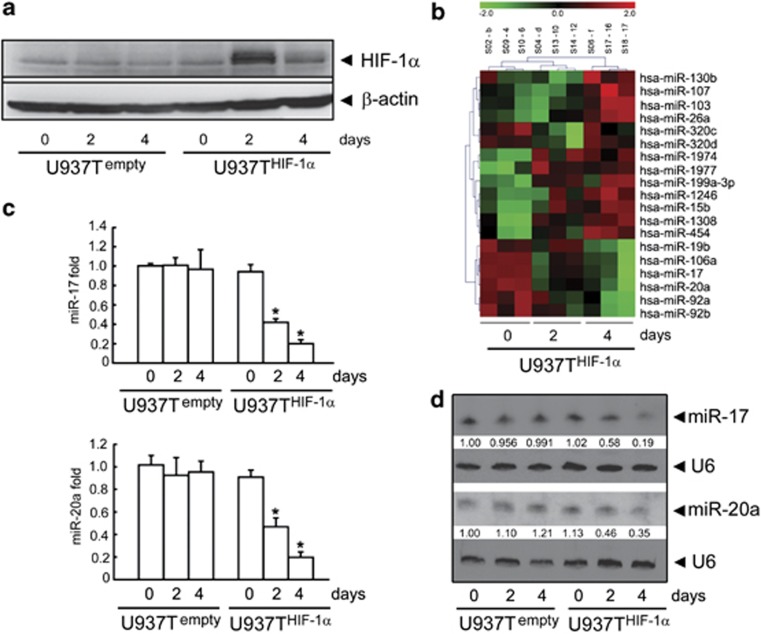
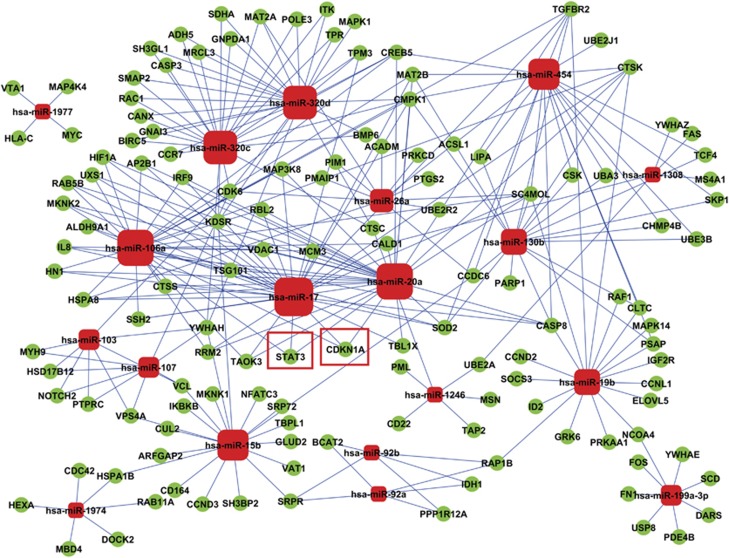
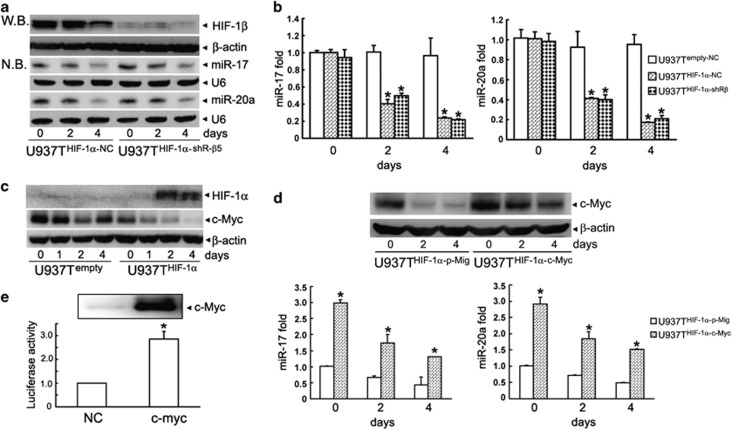
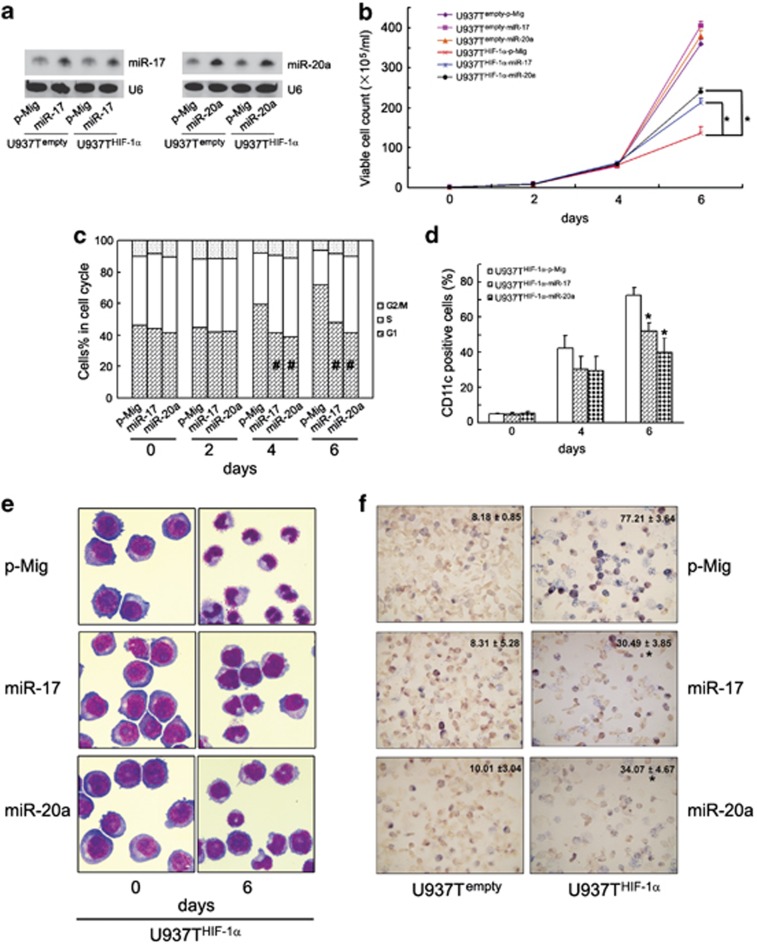
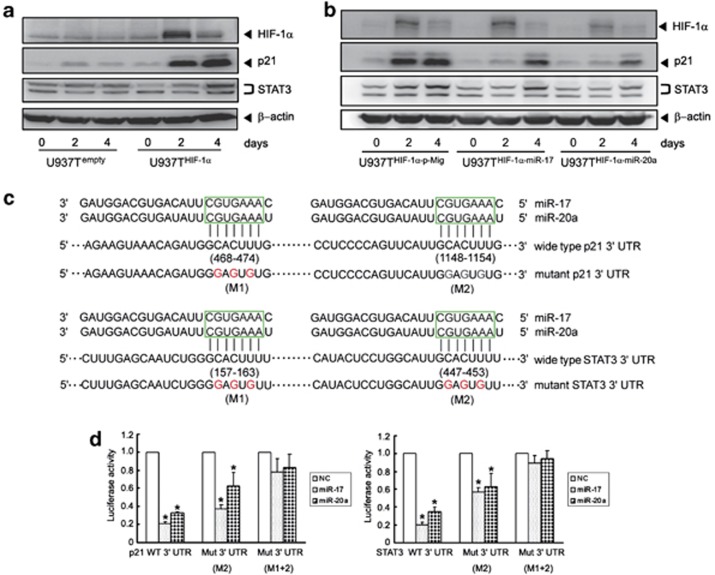
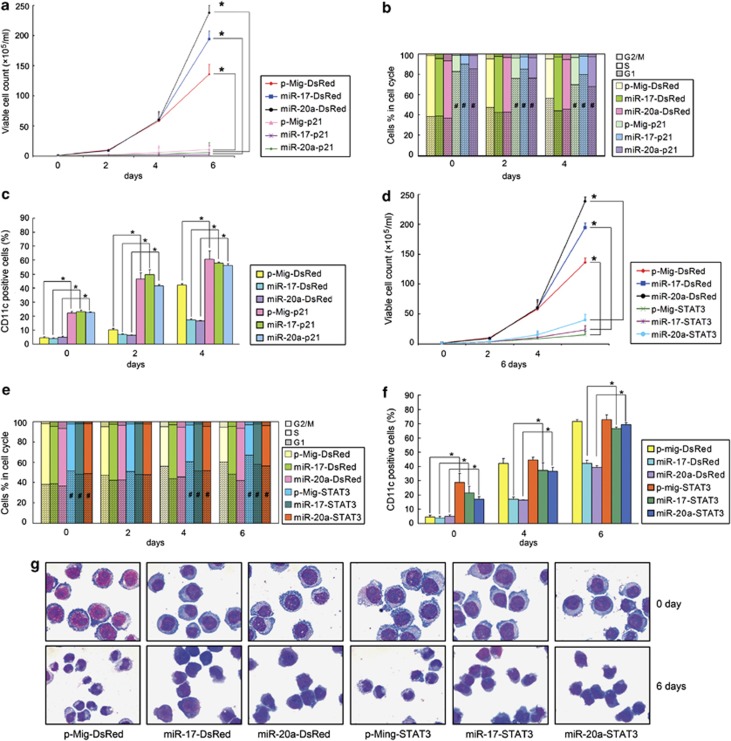
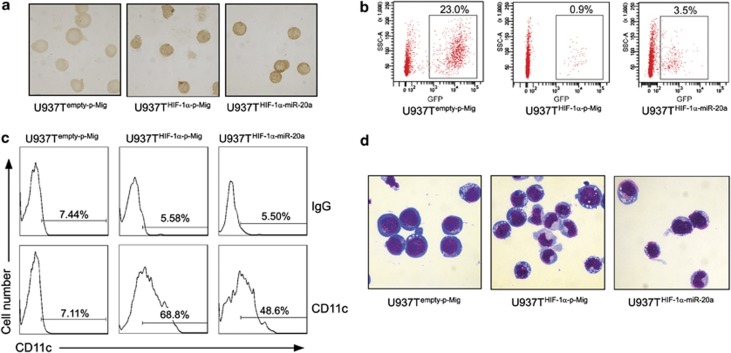
Hypoxia-inducible factor 1 (HIF-1) is a crucial transcription factor for the cellular adaptive response to hypoxia, which contributes to multiple events in cancer biology. MicroRNAs (miRNAs) are involved in almost all cellular activities such as differentiation, proliferation, and apoptosis. In this work, we use miRNA microarrays to profile miRNA expression in acute myeloid leukemia (AML) cells with inducible HIF-1α expression, and identify 19 differentially expressed miRNAs. Our study shows that HIF-1α represses the expression of miR-17 and miR-20a by downregulating c-Myc expression. These two miRNAs alleviate hypoxia and HIF-1α-induced differentiation of AML cells. More intriguingly, miR-17 and miR-20a directly inhibit the p21 and STAT3 (signal transducer and activator of transcription 3) expression, both of which can reverse miR-17/miR-20a-mediated abrogation of HIF-1α-induced differentiation. Moreover, we show in vivo that miR-20a contributes to HIF-1α-induced differentiation of leukemic cells. Taken together, our results suggest that HIF-1α regulates the miRNA network to interfere with AML cell differentiation, representing a novel molecular mechanism for HIF-1-mediated anti-leukemic action.


Figures

Figure 1
Figure 1
Validation of HIF-1α regulated miRNA expression profiles in U937 cells. (a) HIF-1α expression in U937Tempty and U937THIF-1α cells on days 0, 2, and 4 after tetracycline removal. (b) Heat map of differentially expressed miRNA profiling upon HIF-1α induction in U937THIF-1α cells. Differential profiling using microarrays included three samples per group and time point. Red indicates upregulated and green shows downregulated miRNAs. The upper number of the map ‘−2 to 2' represents the z-value range, while the labels from S02-b to S18-17 represent sample names of different groups. (c and d) Validation of the downregulated expression of miR-17 or miR-20a by miRNA-specific qRT-PCR (c) and northern blot (d). Triplicate assays were done for each RNA sample and the relative amount of each miRNA was normalized to U6 snRNA. Statistically significant differences among three groups in different time point was indicated by *P<0.05
Figure 2
Figure 2
miRNA-target gene network analysis. Red box nodes represented miRNAs and green cycle nodes represented target genes. Edges indicated the inhibitive effect of miRNAs on target genes. The red boundary square showed the two putative target genes of miR-17 and miR-20a, p21 (or CDKN1A), and STAT3
Figure 3
Figure 3
HIF-1α inhibits miR-17 and miR-20a expression by downregulating c-Myc, but independently of HIF-1β. (a and b) MiR-17 and miR-20a expressions in U937THIF-1α cells transfected with shRNA against HIF-1β (U937THIF-1α-shR-β5) or a negative control shRNA (U937THIF-1α-NC) were determined by northern blot (NB) (a) and miRNA-specific qRT-PCR (b). Triplicate assays were done for each RNA sample and the relative amount of each miRNA was normalized to U6 snRNA. The symbol * indicated P<0.05. The HIF-1β protein was detected by western blot (WB) which was shown in the upper panel of (a). (c) Decreased c-Myc protein after conditional induction of HIF-1α in U937Tempty and U937THIF-1α cells. (d) U937THIF-1α cells were stably transfected with c-Myc-expressing retrovirus or control vector (p-Mig) (grouped as U937THIF-1α-c-Myc and U937THIF-1α-p-Mig). MiR-17 (left) or miR-20a (right) expression in above cells was determined by miRNA-specific qRT-PCR. Triplicate assays were done for each RNA sample and the relative amount of each miRNA was normalized to U6 snRNA. The symbol * indicated P<0.05. The overexpression of c-Myc protein was shown in the upper panel of (d). (e) The normalized luciferase activity in HEK293T cells transfected with the promoter of miR-17-92 (pGL4 prom17) in combination with pcDNA, pcDNA-c-Myc. The symbol * indicated P <0.05 to control groups
Figure 4
Figure 4
MiR-17 or miR-20a inhibits HIF-1α-triggered growth arrest and granulocytic differentiation of U937 cells. (a) Validation of overexpression of miR-17 and miR-20a in U937Tempty and U937THIF-1α cells using northern blot. The relative amount of each miRNA was normalized to U6 snRNA. The U937Tempty and U937THIF-1α cells were respectively infected with empty retrovirus vector (p-Mig), miR-17 or miR-20a-expressing retrovirus and then grouped as U937Tempty-p-Mig, U937Tempty-miR-17, U937Tempty-miR-20α or U937THIF-1α-p-Mig, U937THIF-1α-miR-17, and U937THIF-1α-miR-20α, respectively. (bf) The indicated cell lines were grown for the various days after tetracycline removal. Then, the proliferation and differentiation were measured as below: (b) viable cell numbers of the above six transformants, (c) cell-cycle distribution of the three U937THIF-1α transformants, (d) CD11c-positive cells of the three U937THIF-1α transformants (%), (e) cell morphology of the three U937THIF-1α transformants, and (f) NBT reduction of the six transformants (6 days after tetracycline removal). The symbols * and # represented P<0.05 compared respectively with U937THIF-1α-p-Mig cells
Figure 5
Figure 5
p21 and STAT3 are direct target genes of miR-17/miR-20a. (a) Validation of p21 and STAT3 protein levels after conditional HIF-1α induction in U937Tempty and U937THIF-1α cells. (b) Ectopic expression of miR-17 or miR-20a downregulated p21 and STAT3 expression in U937THIF-1α cells. β-Actin was shown as a loading control. (c) The sequence alignment of the p21 and STAT3 3′ UTRs including the predicted miR-17 or miR-20a target site sequence (in 6 boundary square). Mutation of the miR17 or miR-20a target site sequence was shown below (red is the mutants). (d) Luciferase reporter assays to confirm targeting of p21 (left) and STAT3 (right) 3′ UTR by miR-17 or miR-20a. The data were means from three independent experiments. The abbreviations are shown as: the full-length 3′ UTR of p21 or STAT3 (3′ UTR WT), only one mutation of the second conserved sites (3′ UTR mutant M2) and double mutations of both conserved sites (3′ UTR mutant M1+2). The symbols * indicated P<0.05 to control groups
Figure 6
Figure 6
MiR-17 and miR-20a counteract the effects of HIF-1α by inhibiting p21 and STAT3. Growth curve (a), cell-cycle distribution (b), and CD11c-positive cells (%) (c) of U937THIF-1α-p-Mig, U937THIF-1α-miR-17, or U937THIF-1α-miR-20α cells infected with p21-expressing retrovirus (grouped as p-Mig-p21, miR-17-p21, or miR-20a-p21) or control vector (grouped as p-Mig-DsRed, miR-17-DsRed, or miR-20a-DsRed) in different days after tetracycline removal. Growth curve (d), cell-cycle distribution (e), and CD11c-positive cells (%) (f) of U937THIF-1α-p-Mig, U937THIF-1α-miR-17, or U937THIF-1α-miR-20α cells infected with STAT3α-expressing retrovirus (grouped as p-Mig-STAT3α, miR-17-STAT3α, or miR-20a-STAT3α) or control vectors (grouped as p-Mig-DsRed, miR-17-DsRed, or miR-20a-DsRed) on indicated days after tetracycline removal. (g) Cell morphology in p-Mig-STAT3α, miR-17-STAT3α, or miR-20a-STAT3α groups and control vector groups on indicated days after tetracycline removal. The symbols * and # represented P<0.05 compared with respective control vector groups
Figure 7
Figure 7
Ectopic expression of miR-20a in U937THIF-1α cells impairs the granulocytic differentiation induced by HIF-1α and promotes proliferation in vivo. (a) Immunocytochemical staining of HIF-1α in the U937 cells isolated from the bone marrow of the engrafted mice on day 10 after the transplantation. Mice were injected with U937Tempty-p-Mig cells (control, left), U937T cells with inducible HIF-1α (U937THIF-1α-p-Mig, middle), or U937THIF-1α cells infected with miR-20a-expressing retrovirus (U937THIF-1α-miR-20α, right), respectively. (b) miR-20a affected the U937 cell proliferation in the bone marrow of the engrafted mice. A representative dot plot analysis from one of three independent experiments. Numbers were shown as the percentage of GFP-positive cells from 1 × 10⁵ acquired bone marrow cells on day 21 after the transplantation. (c) CD11c-positive cells (%) in GFP-positive cells isolated from the bone marrow of the engrafted mice on day 10 after the transplantation (n=5). (d) Cell morphology of GFP-positive cells isolated from the bone marrow of the engrafted mice on day 10 after the transplantation (n=5)

References

    1. Semenza GL. Oxygen sensing, homeostasis, and disease. N Engl J Med. 365:537–547. - PubMed
    1. Semenza GL. Targeting HIF-1 for cancer therapy. Nat Rev Cancer. 2003;3:721–732. - PubMed
    1. Nicholas SA, Sumbayev VV. The involvement of hypoxia-inducible factor 1 alpha in Toll-like receptor 7/8-mediated inflammatory response. Cell Res. 2009;19:973–983. - PubMed
    1. Hanahan D, Weinberg RA. Hallmarks of cancer: the next generation. Cell. 2011;144:646–674. - PubMed
    1. Huang Y, Du KM, Xue ZH, Yan H, Li D, Liu W, et al. Cobalt chloride and low oxygen tension trigger differentiation of acute myeloid leukemic cells: possible mediation of hypoxia-inducible factor-1alpha. Leukemia. 2003;17:2065–2073. - PubMed

Publication types

MeSH terms