

Automated dispersion and orientation analysis for carbon nanotube reinforced polymer composites
- PMID: 23060008
- PMCID: PMC3492886
- DOI: 10.1088/0957-4484/23/43/435706
Automated dispersion and orientation analysis for carbon nanotube reinforced polymer composites
Abstract
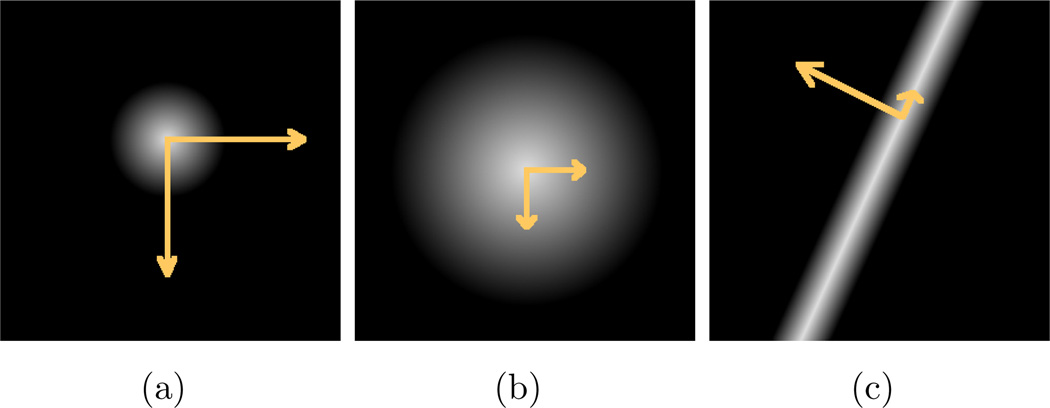
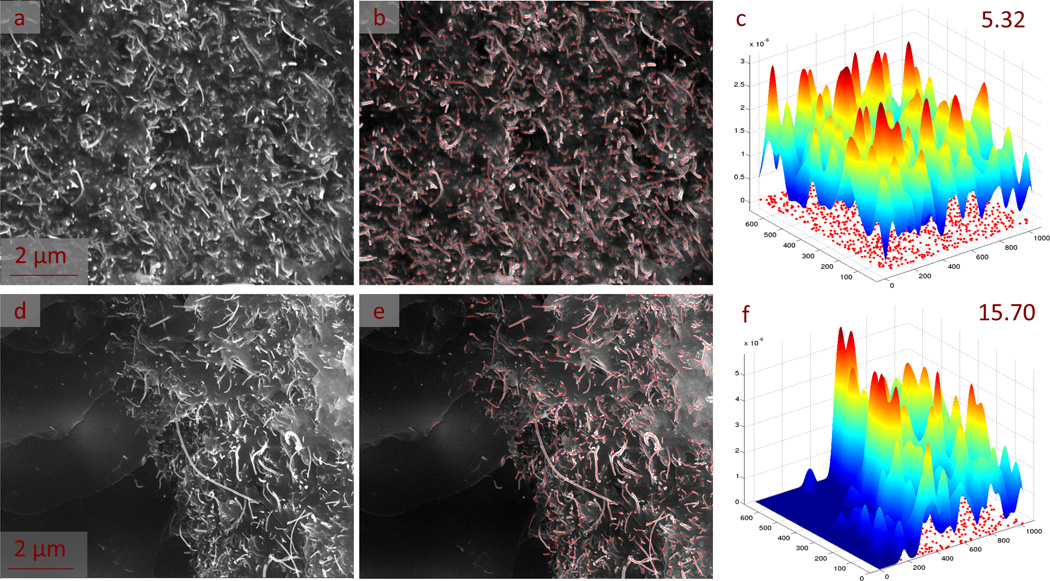
The properties of carbon nanotube (CNT)/polymer composites are strongly dependent on the dispersion and orientation of CNTs in the host matrix. Quantification of the dispersion and orientation of CNTs by means of microstructure observation and image analysis has been demonstrated as a useful way to understand the structure-property relationship of CNT/polymer composites. However, due to the various morphologies and large amount of CNTs in one image, automatic and accurate identification of CNTs has become the bottleneck for dispersion/orientation analysis. To solve this problem, shape identification is performed for each pixel in the filler identification step, so that individual CNTs can be extracted from images automatically. The improved filler identification enables more accurate analysis of CNT dispersion and orientation. The dispersion index and orientation index obtained for both synthetic and real images from model compounds correspond well with the observations. Moreover, these indices help to explain the electrical properties of CNT/silicone composite, which is used as a model compound. This method can also be extended to other polymer composites with high-aspect-ratio fillers.
Figures


References
-
- Chae HG, Kumar S. Making strong fibers. Science. 2008;319(5865):908. - PubMed
-
- Jones ACDKM, Bekkedahl T, Kiang C. Storage of hydrogen in single-walled carbon nanotubes. Nature. 1997;386:377.
-
- Zhou C, Kumar S, Doyle CD, James M. Functionalized single wall carbon nanotubes treated with pyrrole for electrochemical supercapacitor membranes. Chemistry of materials. 2005;17(8):1997–2002.
-
- Ounaies Z, Park C, Wise KE, Siochi EJ, Harrison JS. Electrical properties of single wall carbon nanotube reinforced polyimide composites. Composites Science and Technology. 2003;63(11):1637–1646.
-
- Peng H. Aligned carbon nanotube/polymer composite films with robust exibility, high transparency, and excellent conductivity. Journal of the American Chemical Society. 2008;130(1):42–43. - PubMed
Publication types
Grants and funding
LinkOut - more resources
Full Text Sources