

Identification of candidate downstream targets of TGFβ signaling during palate development by genome-wide transcript profiling
- PMID: 23060211
- PMCID: PMC3777336
- DOI: 10.1002/jcb.24417
Identification of candidate downstream targets of TGFβ signaling during palate development by genome-wide transcript profiling
Abstract
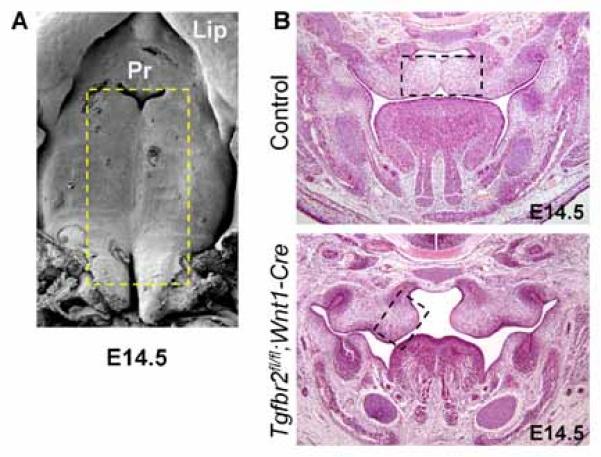
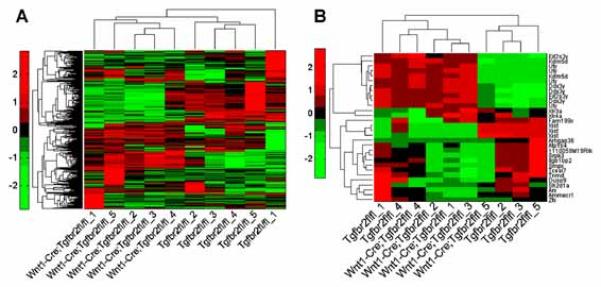
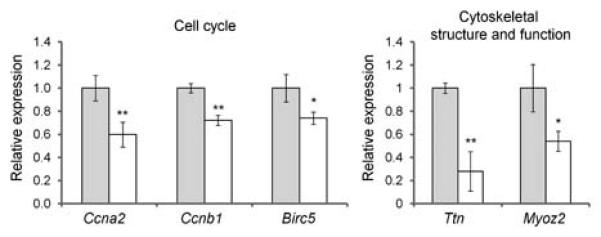
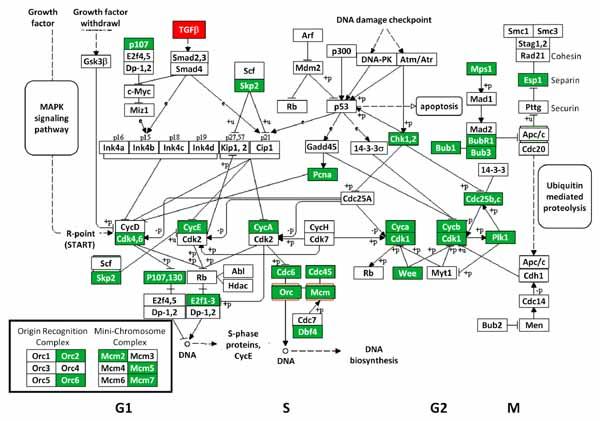
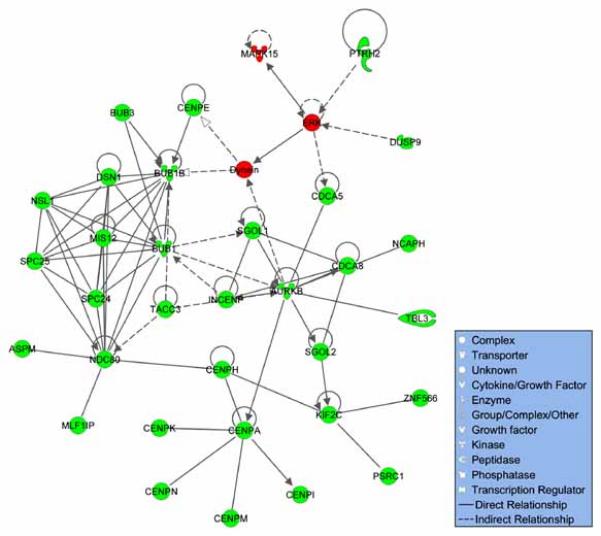
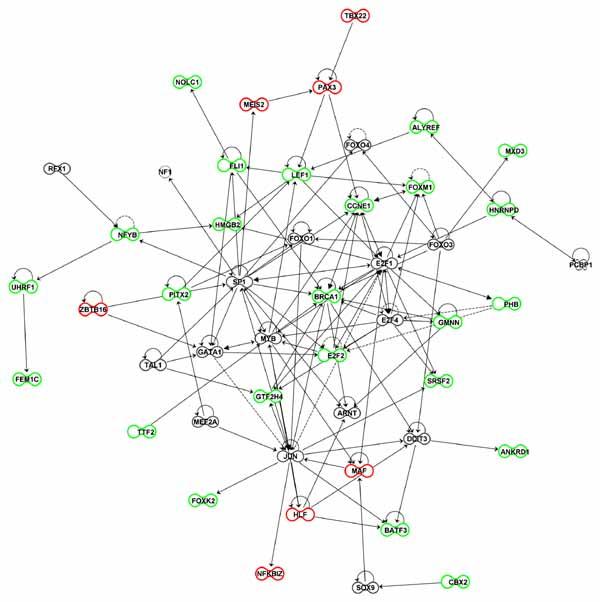
Nonsyndromic orofacial clefts are common birth defects whose etiology is influenced by complex genetic and environmental factors and gene-environment interactions. Although these risk factors are not yet fully elucidated, it is known that alterations in transforming growth factor-beta (TGFβ) signaling can cause craniofacial abnormalities, including cleft palate, in mammals. To elucidate the downstream targets of TGFβ signaling in palatogenesis, we analyzed the gene expression profiles of Tgfbr2(fl/fl) ;Wnt1-Cre mouse embryos with cleft palate and other craniofacial deformities resulting from the targeted inactivation of the Tgfbr2 gene in their cranial neural crest (CNC) cells. Relative to controls, palatal tissues obtained from Tgfbr2(fl/fl) ;Wnt1-Cre mouse embryos at embryonic day 14.5 (E14.5) of gestation have a robust gene expression signature reflective of known defects in CNC-derived mesenchymal cell proliferation. Groups of differentially expressed genes (DEGs) were involved in diverse cellular processes and components associated with orofacial clefting, including the extracellular matrix, cholesterol metabolism, ciliogenesis, and multiple signaling pathways. A subset of the DEGs are known or suspected to be associated with an increased risk of orofacial clefting in humans and/or genetically engineered mice. Based on bioinformatics analyses, we highlight the functional relationships among differentially expressed transcriptional regulators of palatogenesis as well as transcriptional factors not previously associated with this process. We suggest that gene expression profiling studies of mice with TGFβ signaling defects provide a valuable approach for identifying candidate mechanisms by which this pathway controls cell fate during palatogenesis and its role in the etiology of human craniofacial abnormalities.
Copyright © 2012 Wiley Periodicals, Inc.
Figures
Similar articles
-
Modulation of lipid metabolic defects rescues cleft palate in Tgfbr2 mutant mice.Hum Mol Genet. 2014 Jan 1;23(1):182-93. doi: 10.1093/hmg/ddt410. Epub 2013 Aug 23. Hum Mol Genet. 2014. PMID: 23975680 Free PMC article.
-
Fibroblast growth factor 9 (FGF9)-pituitary homeobox 2 (PITX2) pathway mediates transforming growth factor β (TGFβ) signaling to regulate cell proliferation in palatal mesenchyme during mouse palatogenesis.J Biol Chem. 2012 Jan 20;287(4):2353-63. doi: 10.1074/jbc.M111.280974. Epub 2011 Nov 28. J Biol Chem. 2012. PMID: 22123828 Free PMC article.
-
Noncanonical transforming growth factor β (TGFβ) signaling in cranial neural crest cells causes tongue muscle developmental defects.J Biol Chem. 2013 Oct 11;288(41):29760-70. doi: 10.1074/jbc.M113.493551. Epub 2013 Aug 15. J Biol Chem. 2013. PMID: 23950180 Free PMC article.
-
Transforming growth factor beta (TGFbeta) signalling in palatal growth, apoptosis and epithelial mesenchymal transformation (EMT).Arch Oral Biol. 2004 Sep;49(9):675-89. doi: 10.1016/j.archoralbio.2004.05.007. Arch Oral Biol. 2004. PMID: 15275855 Review.
-
Closing the Gap: Mouse Models to Study Adhesion in Secondary Palatogenesis.J Dent Res. 2017 Oct;96(11):1210-1220. doi: 10.1177/0022034517726284. Epub 2017 Aug 17. J Dent Res. 2017. PMID: 28817360 Free PMC article. Review.
Cited by
-
Chronic Disruption of the Late Cholesterol Synthesis Leads to Female-Prevalent Liver Cancer.Cancers (Basel). 2020 Nov 9;12(11):3302. doi: 10.3390/cancers12113302. Cancers (Basel). 2020. PMID: 33182326 Free PMC article.
-
A developmental stage-specific network approach for studying dynamic co-regulation of transcription factors and microRNAs during craniofacial development.Development. 2020 Dec 24;147(24):dev192948. doi: 10.1242/dev.192948. Development. 2020. PMID: 33234712 Free PMC article.
-
Integrated assessment of differentially expressed plasma microRNAs in subtypes of nonsyndromic orofacial clefts.Medicine (Baltimore). 2018 Jun;97(25):e11224. doi: 10.1097/MD.0000000000011224. Medicine (Baltimore). 2018. PMID: 29924053 Free PMC article. Clinical Trial.
-
SMAD4 target genes are part of a transcriptional network that integrates the response to BMP and SHH signaling during early limb bud patterning.Development. 2021 Dec 1;148(23):dev200182. doi: 10.1242/dev.200182. Epub 2021 Dec 3. Development. 2021. PMID: 34822715 Free PMC article.
-
Current Controversies in Diagnosis and Management of Cleft Palate and Velopharyngeal Insufficiency.Biomed Res Int. 2015;2015:196240. doi: 10.1155/2015/196240. Epub 2015 Jul 26. Biomed Res Int. 2015. PMID: 26273595 Free PMC article. Review.
References
-
- Beaty TH, Ruczinski I, Murray JC, Marazita ML, Munger RG, Hetmanski JB, Murray T, Redett RJ, Fallin MD, Liang KY, Wu T, Patel PJ, Jin SC, Zhang TX, Schwender H, Wu-Chou YH, Chen PK, Chong SS, Cheah F, Yeow V, Ye X, Wang H, Huang S, Jabs EW, Shi B, Wilcox AJ, Lie RT, Jee SH, Christensen K, Doheny KF, Pugh EW, Ling H, Scott AF. Evidence for gene-environment interaction in a genome wide study of nonsyndromic cleft palate. Genet Epidemiol. 2011;35:469–478. - PMC - PubMed
-
- Choudhary B, Ito Y, Makita T, Sasaki T, Chai Y, Sucov HM. Cardiovascular malformations with normal smooth muscle differentiation in neural crest-specific type II TGFbeta receptor (Tgfbr2) mutant mice. Dev Biol. 2006;289:420–429. - PubMed
Publication types
MeSH terms
Substances
Grants and funding
LinkOut - more resources
Full Text Sources
Other Literature Sources
Medical
Molecular Biology Databases
