

Development of a resource modelling tool to support decision makers in pandemic influenza preparedness: The AsiaFluCap Simulator
- PMID: 23061807
- PMCID: PMC3509032
- DOI: 10.1186/1471-2458-12-870
Development of a resource modelling tool to support decision makers in pandemic influenza preparedness: The AsiaFluCap Simulator
Abstract
Background: Health care planning for pandemic influenza is a challenging task which requires predictive models by which the impact of different response strategies can be evaluated. However, current preparedness plans and simulations exercises, as well as freely available simulation models previously made for policy makers, do not explicitly address the availability of health care resources or determine the impact of shortages on public health. Nevertheless, the feasibility of health systems to implement response measures or interventions described in plans and trained in exercises depends on the available resource capacity. As part of the AsiaFluCap project, we developed a comprehensive and flexible resource modelling tool to support public health officials in understanding and preparing for surges in resource demand during future pandemics.
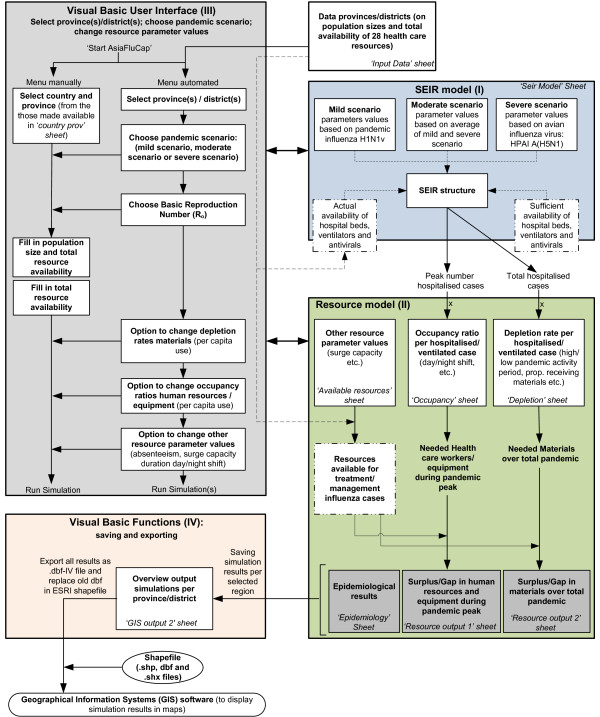
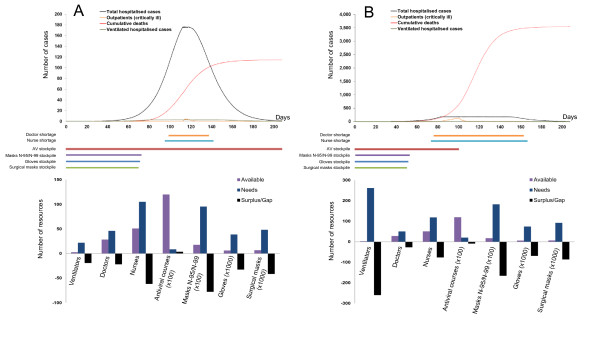
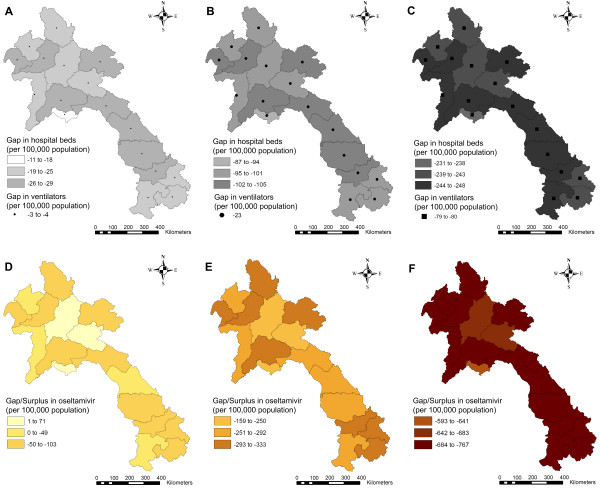
Results: The AsiaFluCap Simulator is a combination of a resource model containing 28 health care resources and an epidemiological model. The tool was built in MS Excel© and contains a user-friendly interface which allows users to select mild or severe pandemic scenarios, change resource parameters and run simulations for one or multiple regions. Besides epidemiological estimations, the simulator provides indications on resource gaps or surpluses, and the impact of shortages on public health for each selected region. It allows for a comparative analysis of the effects of resource availability and consequences of different strategies of resource use, which can provide guidance on resource prioritising and/or mobilisation. Simulation results are displayed in various tables and graphs, and can also be easily exported to GIS software to create maps for geographical analysis of the distribution of resources.
Conclusions: The AsiaFluCap Simulator is freely available software (http://www.cdprg.org) which can be used by policy makers, policy advisors, donors and other stakeholders involved in preparedness for providing evidence based and illustrative information on health care resource capacities during future pandemics. The tool can inform both preparedness plans and simulation exercises and can help increase the general understanding of dynamics in resource capacities during a pandemic. The combination of a mathematical model with multiple resources and the linkage to GIS for creating maps makes the tool unique compared to other available software.
Figures
Similar articles
-
Pandemic influenza preparedness plan in Liguria, Italy: a valuable tool for Public Health.J Prev Med Hyg. 2024 Aug 31;65(2):E245-E250. doi: 10.15167/2421-4248/jpmh2024.65.2.3146. eCollection 2024 Jun. J Prev Med Hyg. 2024. PMID: 39430996 Free PMC article.
-
Pandemic influenza preparedness in the WHO African region: are we ready yet?BMC Infect Dis. 2018 Nov 14;18(1):567. doi: 10.1186/s12879-018-3466-1. BMC Infect Dis. 2018. PMID: 30428846 Free PMC article.
-
Pandemic influenza preparedness in Africa is a profound challenge for an already distressed region: analysis of national preparedness plans.Health Policy Plan. 2008 May;23(3):161-9. doi: 10.1093/heapol/czn004. Epub 2008 Apr 1. Health Policy Plan. 2008. PMID: 18381384 Free PMC article.
-
Modelling during an emergency: the 2009 H1N1 influenza pandemic.Clin Microbiol Infect. 2013 Nov;19(11):1014-22. doi: 10.1111/1469-0691.12284. Epub 2013 Jun 25. Clin Microbiol Infect. 2013. PMID: 23800220 Review.
-
Public Health Policy and Experience of the 2009 H1N1 Influenza Pandemic in Pune, India.Int J Health Policy Manag. 2018 Feb 1;7(2):154-166. doi: 10.15171/ijhpm.2017.54. Int J Health Policy Manag. 2018. PMID: 29524939 Free PMC article. Review.
Cited by
-
Balancing scarce hospital resources during the COVID-19 pandemic using discrete-event simulation.Health Care Manag Sci. 2021 Jun;24(2):356-374. doi: 10.1007/s10729-021-09548-2. Epub 2021 Apr 9. Health Care Manag Sci. 2021. PMID: 33835338 Free PMC article.
-
Considerations for acute care staffing during a pandemic.Best Pract Res Clin Anaesthesiol. 2021 Oct;35(3):389-404. doi: 10.1016/j.bpa.2020.12.008. Epub 2020 Dec 10. Best Pract Res Clin Anaesthesiol. 2021. PMID: 34511227 Free PMC article. Review.
-
Integrating patient metadata and pathogen genomic data: advancing pandemic preparedness with a multi-parametric simulator.BMC Res Notes. 2025 Apr 15;18(1):174. doi: 10.1186/s13104-025-07207-1. BMC Res Notes. 2025. PMID: 40234988 Free PMC article.
-
An Integrated Needs-Based Approach to Health Service and Health Workforce Planning: Applications for Pandemic Influenza.Healthc Policy. 2017 Aug;13(1):28-42. doi: 10.12927/hcpol.2017.25193. Healthc Policy. 2017. PMID: 28906234 Free PMC article.
-
Controlling infectious disease outbreaks: A deterministic allocation-scheduling model with multiple discrete resources.J Syst Sci Syst Eng. 2017;26(2):219-239. doi: 10.1007/s11518-016-5327-z. Epub 2017 Jan 24. J Syst Sci Syst Eng. 2017. PMID: 32288410 Free PMC article.
References
-
- Svoboda T, Henry B, Shulman L, Kennedy E, Rea E, Ng W, Wallington T, Yaffe B, Gournis E, Vicencio E. et al.Public health measures to control the spread of the severe acute respiratory syndrome during the outbreak in Toronto. N Engl J Med. 2004;350(23):2352–2361. doi: 10.1056/NEJMoa032111. - DOI - PubMed
-
- UNSIC, World Bank. Animal and pandemic influenza: A framework for sustaining momentum, fifth global progress report. http://un-influenza.org/files/Global%20Progress%20Report%202010.pdf.
-
- Dawood FS, Jain S, Finelli L, Shaw MW, Lindstrom S, Garten RJ, Gubareva LV, Xu X, Bridges CB, Uyeki TM. Emergence of a novel swine-origin influenza A (H1N1) virus in humans. N Engl J Med. 2009;360(25):2605–2615. - PubMed
-
- UNSIC. Simulation exercises on influenza pandemic responses in the Asia Pacific region. http://un-influenza.org/files/asia_pacific/temp/unsic_pandemic_complete.pdf.
Publication types
MeSH terms
LinkOut - more resources
Full Text Sources
Medical
Research Materials
