. 2012 Oct 12;14(5):R131.
doi: 10.1186/bcr3329.

Co-expression of HER2 and HER3 receptor tyrosine kinases enhances invasion of breast cells via stimulation of interleukin-8 autocrine secretion

Co-expression of HER2 and HER3 receptor tyrosine kinases enhances invasion of breast cells via stimulation of interleukin-8 autocrine secretion

Nicola Aceto et al. Breast Cancer Res. .

Abstract

Introduction: The tyrosine kinase receptors HER2 and HER3 play an important role in breast cancer. The HER2/HER3 heterodimer is a critical oncogenic unit associated with reduced relapse-free and decreased overall survival. While signaling cascades downstream of HER2 and HER3 have been studied extensively at the level of post-translational modification, little is known about the effects of HER2/HER3 overexpression and activation on gene expression in breast cancer. We have now defined the genetic landscape induced by activation of the HER2/HER3 unit in mammary cells, and have identified interleukin (IL)8 and CXCR1 as potential therapeutic targets for the treatment of HER2/HER3-overexpressing breast cancers.

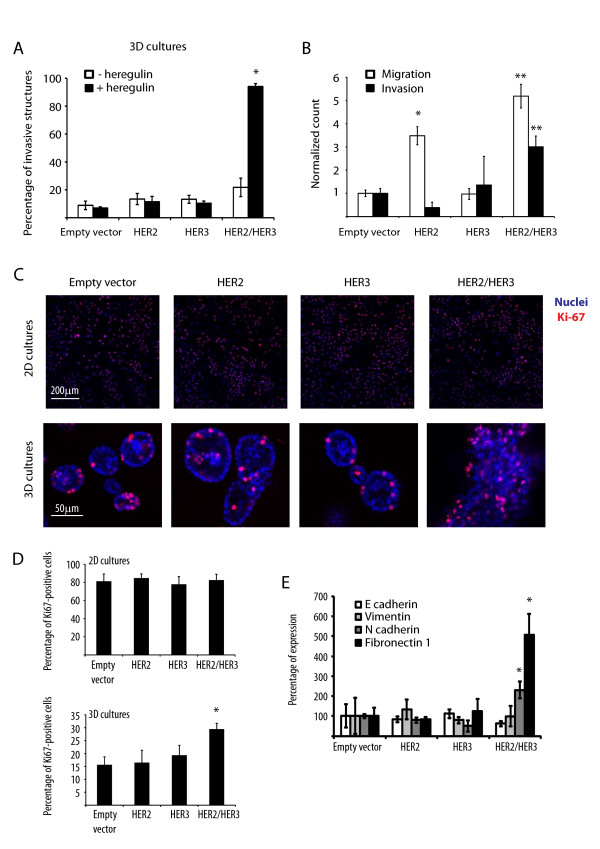
Methods: Three-dimensional (3D) cultures, invasion and migration assays were used to determine the effects of HER2 and HER3 co-expression and activation. Gene expression analysis was performed to identify the gene network induced by HER2/HER3 in 3D cultures. Bioinformatic analysis and neutralizing antibodies were used to identify key mediators of HER2/HER3-evoked invasion.

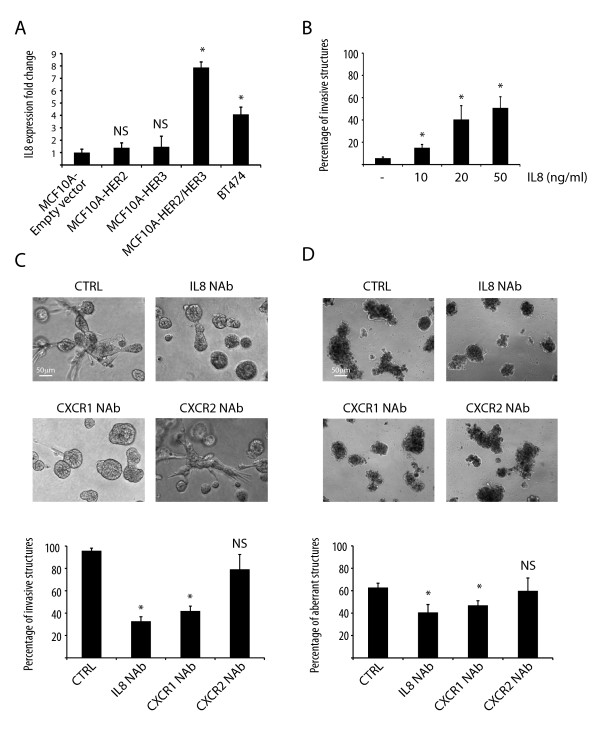
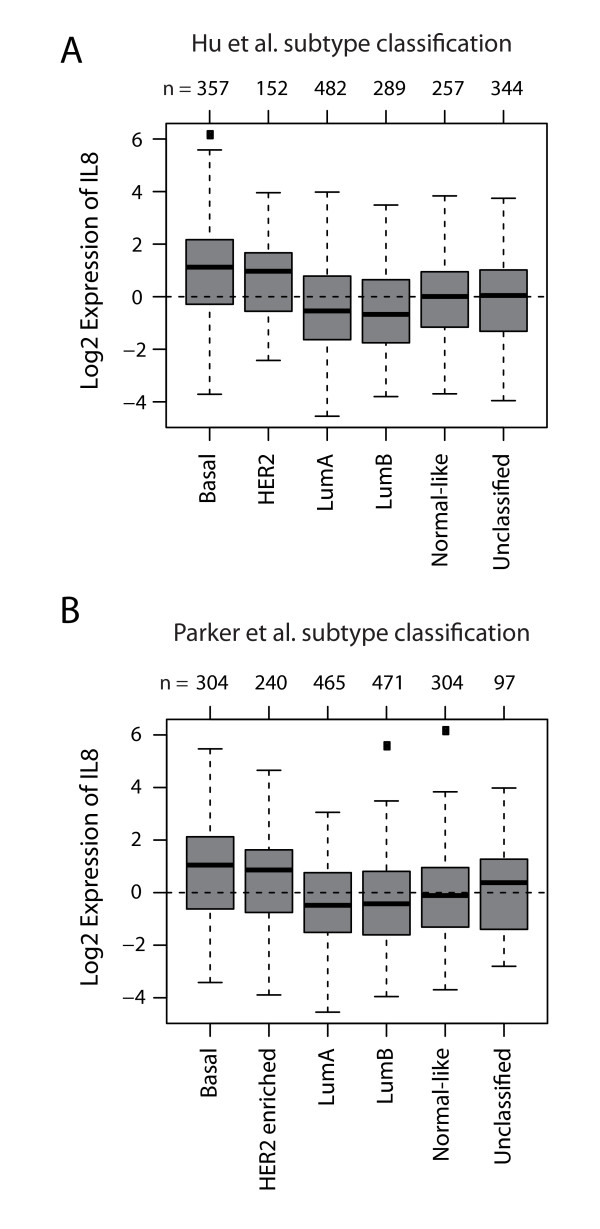
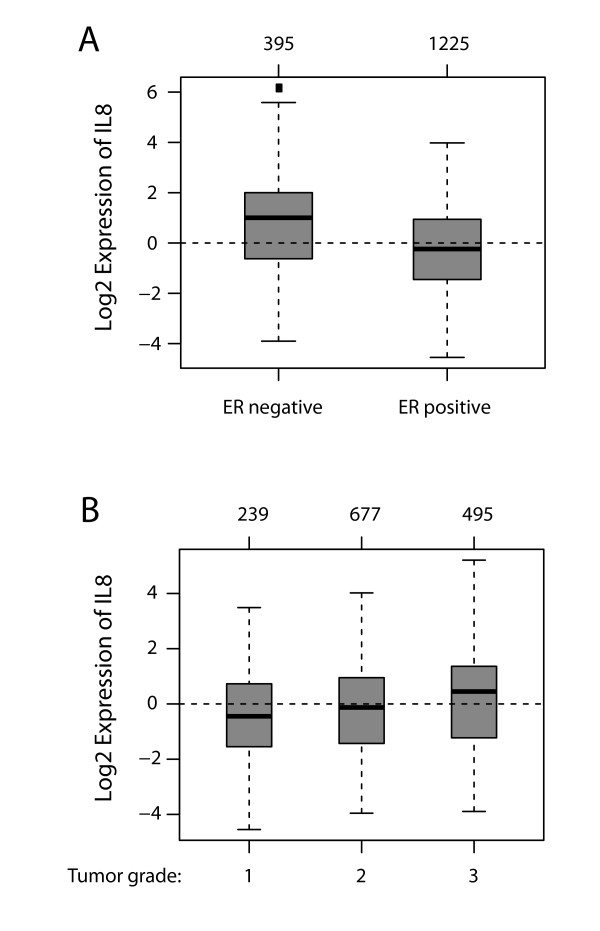
Results: Co-expression of the tyrosine kinase receptors HER2 and HER3 induced migration and invasion of MCF10A cells. Microarray analysis of these cells revealed a specific "HER2/HER3 signature" comprising 80 upregulated transcripts, with IL8 being the highest (11-fold upregulation). Notably, examination of public datasets revealed high levels of IL8 transcripts in HER2-enriched as well as basal-like primary breast tumors, two subtypes characterized by a particularly poor prognosis. Moreover, IL8 expression correlated with high tumor grade and ER-negative status. Importantly, treatment with IL8-neutralizing antibodies prevented invasion of MCF10A-HER2/HER3 and BT474 cells in 3D cultures, highlighting the importance of IL8 autocrine signaling upon HER2/HER3 activation.

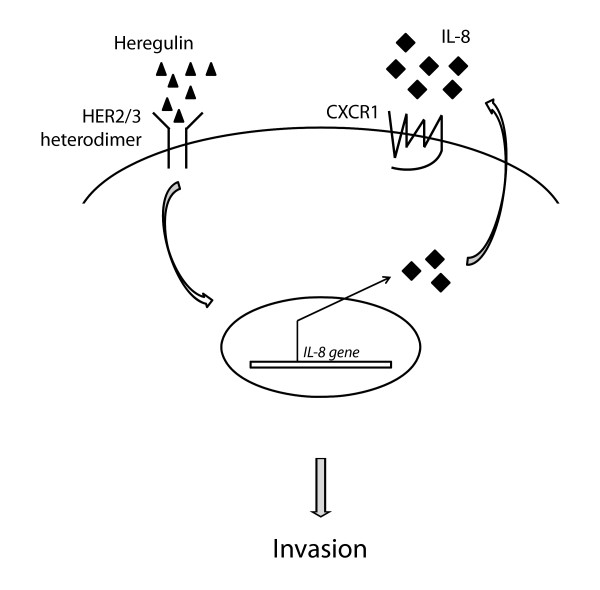
Conclusions: Our findings demonstrate that HER2 and HER3 co-expression induces IL8 autocrine signaling, leading to the invasion of mammary cells. Agents targeting IL8 or its receptor CXCR1 may be useful for the treatment of HER2/HER3/IL8-positive breast cancers with invasive traits.


Figures

Figure 1
Figure 1
HER2 and HER3 co-expression induces mammary cell invasion, migration and proliferation. (A) Percentages of invasive structures in the presence or absence of heregulin 10 ng/ml. Results represent means ± standard error of the mean (SEM) (n = 3, *P < 0.05). (B) Normalized cell count for the migration and invasion assays. Results represent means ± SEM (n = 3, *P < 0.003, **P < 0.002). (C) Representative confocal images of equatorial cross-sections of MCF10A cells expressing empty vector, HER2, HER3 or HER2/HER3 grown in two- or three-dimensional cultures for 15 days in the presence of 10 ng/ml heregulin and stained with TO-PRO (blue) and anti-Ki67 antibodies (red). (D) Percentage of Ki67-positive cells when grown in two- or three-dimensional cultures. Results represent means ± SEM (n = 3, *P < 0.03). (E) Quantitative real-time PCR on RNA extracts of MCF10A cells expressing empty vector, HER2, HER3 or HER2/HER3 grown in two- or three-dimensional cultures for 15 days in the presence of 10 ng/ml heregulin. Quantitative real-time PCR was performed using primers against the epithelial-to-mesenchymal transition (EMT) markers E-cadherin, N-cadherin, vimentin and fibronectin1. Results represent means ± SEM (n = 3, *P < 0.05).
Figure 2
Figure 2
IL8 or CXCR1 blockade reduces HER2/HER3-evoked invasion of mammary cells. (A) Quantitative real-time PCR of IL8. The bar graph shows the percentages of IL8 expression in MCF10A cells expressing empty vector, HER2, HER3 or HER2/HER3, as well as in the HER2/HER3-positive breast cancer cell line BT474. Results represent means ± standard error of the mean (SEM) (n = 3, *P < 0.018; NS, not significant). (B) Percentage of invasive structures upon stimulation of MCF10A cells with IL8. Results represent means ± SEM (n = 3, *P < 0.05). (C) Representative phase-contrast pictures of MCF10A-HER2/HER3 cells grown in three-dimensional cultures for 15 days in the presence of heregulin and the indicated neutralizing antibodies. The bar graph shows the percentages of invasive structures. Results represent means ± SEM (n = 3, *P < 0.0004; NS, not significant). (D) Representative phase-contrast pictures of BT474 cells grown in three-dimensional cultures for 15 days in the presence of heregulin and neutralizing antibodies. The bar graph shows the percentages of aberrant structures. Results represent means ± SEM (n = 3; *P < 0.05; NS, not significant). CTRL, control.
Figure 3
Figure 3
IL8 expression correlates with HER2-enriched and basal breast cancers. Gene set analysis (GSA) of IL8 expression in a dataset comprising 1,881 primary breast tumors http://co.bmc.lu.se/gobo. (A) Box plot of IL8 expression in breast tumor samples classified into six molecular subtypes according to the classifiers of Hu et al. [16]; P < 0.0001 by analysis of variance (ANOVA). (B) Box plot of IL8 expression in breast tumor samples classified into six molecular subtypes according to the classifiers of Parker et al. [17]; P < 0.0001 by ANOVA. Numbers above the charts report the number of patients in each subtype group.
Figure 4
Figure 4
IL8 expression correlates with ER-negative and high-grade primary breast tumors. Gene set analysis (GSA) of IL8 in a dataset comprising 1,881 primary breast tumors http://co.bmc.lu.se/gobo. (A). IL8 expression correlates with estrogen receptor (ER)-negative tumors. Box plot of IL8 expression in ER-negative and ER-positive primary breast cancers; P < 0.0001 by analysis of variance (ANOVA). B. IL8 expression correlates with high tumor grade. Box plot of IL8 expression in grade 1, 2 and 3 primary breast cancers, respectively; P < 0.0001 by ANOVA. Numbers above the charts show the number of patients in each subtype group.
Figure 5
Figure 5
Model of the HER2/HER3/IL8 signaling cascade. Heregulin-induced heterodimerization and activation of HER2/HER3 causes upregulation of the IL8 transcript, which in turn mediates invasion via CXCR1.

References

    1. Hynes NE, MacDonald G. ErbB receptors and signaling pathways in cancer. Curr Opin Cell Biol. 2009;14:177–184. doi: 10.1016/j.ceb.2008.12.010. - DOI - PubMed
    1. Slamon DJ, Clark GM, Wong SG, Levin WJ, Ullrich A, McGuire WL. Human breast cancer: correlation of relapse and survival with amplification of the HER-2/neu oncogene. Science. 1987;14:177–182. doi: 10.1126/science.3798106. - DOI - PubMed
    1. Slamon DJ, Leyland-Jones B, Shak S, Fuchs H, Paton V, Bajamonde A, Fleming T, Eiermann W, Wolter J, Pegram M, Baselga J, Norton L. Use of chemotherapy plus a monoclonal antibody against HER2 for metastatic breast cancer that overexpresses HER2. N Engl J Med. 2001;14:783–792. doi: 10.1056/NEJM200103153441101. - DOI - PubMed
    1. Hudis CA. Trastuzumab-mechanism of action and use in clinical practice. N Engl J Med. 2007;14:39–51. doi: 10.1056/NEJMra043186. - DOI - PubMed
    1. Wallasch C, Weiss FU, Niederfellner G, Jallal B, Issing W, Ullrich A. Heregulin-dependent regulation of HER2/neu oncogenic signaling by heterodimerization with HER3. Embo J. 1995;14:4267–4275. - PMC - PubMed

Publication types

MeSH terms