

The relationships between common measures of glucose meter performance
- PMID: 23063034
- PMCID: PMC3570842
- DOI: 10.1177/193229681200600512
The relationships between common measures of glucose meter performance
Abstract
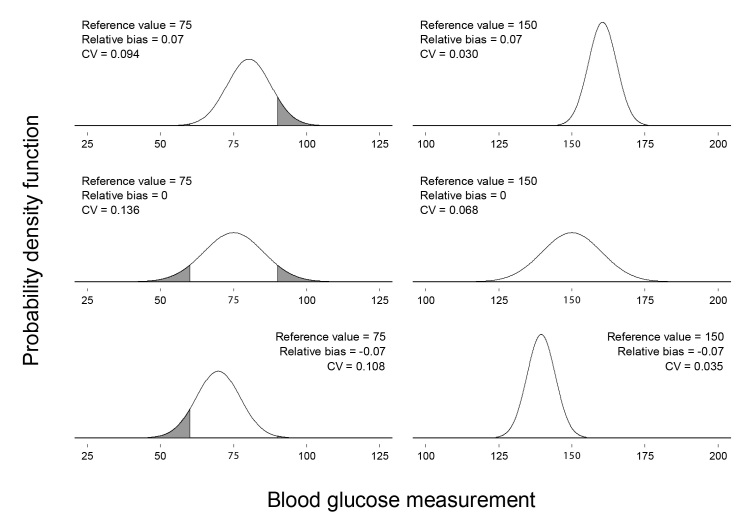
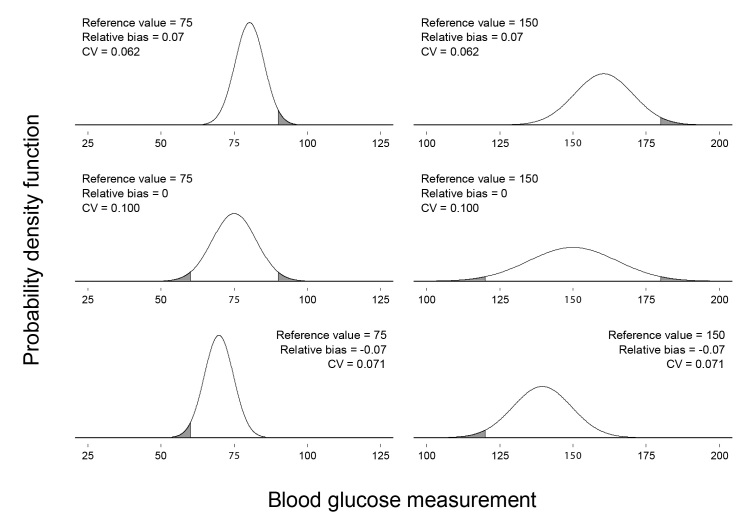
Background: Glucose meter performance is commonly measured in several different ways, including the relative bias and coefficient of variation (CV), the total error, the mean absolute relative deviation (MARD), and the size of the interval around the reference value that would be necessary to contain a meter measurement at a specified probability. This fourth measure is commonly expressed as a proportion of the reference value and will be referred to as the necessary relative deviation. A deeper understanding of the relationships between these measures may aid health care providers, patients, and regulators in comparing meter performances when different measures are used.
Methods: The relationships between common measures of glucose meter performance were derived mathematically.
Results: Equations are presented for calculating the total error, MARD, and necessary relative deviation using the reference value, relative bias, and CV when glucose meter measurements are normally distributed. When measurements are also unbiased, the CV, total error, MARD, and necessary relative deviation are linearly related and are therefore equivalent measures of meter performance.
Conclusions: The relative bias and CV provide more information about meter performance than the other measures considered but may be difficult for some audiences to interpret. Reporting meter performance in multiple ways may facilitate the informed selection of blood glucose meters.
© 2012 Diabetes Technology Society.
Figures

References
-
- Centers for Disease Control and Prevention (CDC) Self-monitoring of blood glucose among adults with diabetes--United States, 1997-2006. MMWR Morb Mortal Wkly Rep. 2007;56(43):1133–1137. - PubMed
-
- UK Prospective Diabetes Study (UKPDS) Group. Intensive blood-glucose control with sulphonylureas or insulin compared with conventional treatment and risk of complications in patients with type 2 diabetes (UKPDS 33) Lancet. 1998;352(9131):837–853. - PubMed
-
- The Diabetes Control and Complications Trial Research Group. The effect of intensive treatment of diabetes on the development and progression of long-term complications in insulin-dependent diabetes mellitus. N Engl J Med. 1993;329(14):977–986. - PubMed
Publication types
MeSH terms
Substances
LinkOut - more resources
Full Text Sources
Medical
