. 2012 Oct 12;151(2):344-55.
doi: 10.1016/j.cell.2012.08.038.

Relative mitochondrial priming of myeloblasts and normal HSCs determines chemotherapeutic success in AML

Affiliations

Relative mitochondrial priming of myeloblasts and normal HSCs determines chemotherapeutic success in AML

Thanh-Trang Vo et al. Cell. .

Abstract

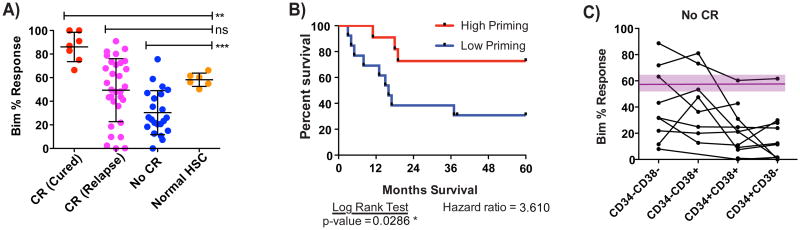
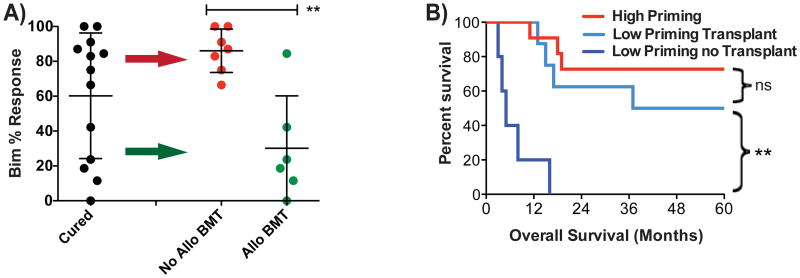
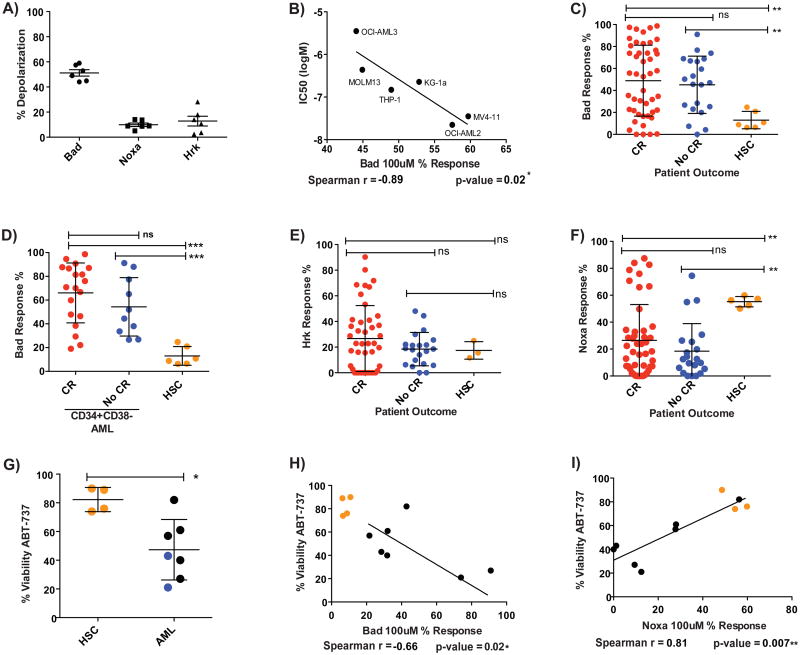
Despite decades of successful use of cytotoxic chemotherapy in acute myelogenous leukemia (AML), the biological basis for its differential success among individuals and for the existence of a therapeutic index has remained obscure. Rather than taking a genetic approach favored by many, we took a functional approach to ask how differential mitochondrial readiness for apoptosis ("priming") might explain individual variation in clinical behavior. We found that mitochondrial priming measured by BH3 profiling was a determinant of initial response to induction chemotherapy, relapse after remission, and requirement for allogeneic bone marrow transplantation. Differential priming between malignant myeloblasts and normal hematopoietic stem cells supports a mitochondrial basis to the therapeutic index for chemotherapy. BH3 profiling identified BCL-2 inhibition as a targeted strategy likely to have a useful therapeutic index. BH3 profiling refines predictive information provided by conventional biomarkers currently in use and thus may itself have utility as a clinical predictive biomarker. PAPERCLIP:


Figures

Figure 1
Figure 1. Mitochondrial Priming Predicts Response to Topoisomerase II Inhibitors
(A) BH3 profiling response of each AML cell line to the BH3 peptides. Priming is measured using 0.3 μM Bim response, the percent mitochondrial depolarization induced by the Bim BH3 peptide. Priming is compared with killing by nucleoside analogs (A) araC and (B) clofarabine, topoisomerase II inhibitors (D) daunorubicin, (E) etoposide and (F) mitoxantrone and DNA demethylating agents (G) azacytidine and (H) decitabine. All are one-tailed Spearman correlations. Treatment with topoisomerase II inhibitors were done in the presence of 20 μM verapamil to exclude the effects of drug pumps. See also Figure S1 and Table S1.
Figure 2
Figure 2. Specifically Increasing Mitochondrial Priming Increases Sensitivity to Chemotherapy
(A) BCL-2 protein levels after lenti-viral introduction of shRNAs into the MOLM13 cell line. (B) Priming as measured by depolarization induced by BIM BH3 at two concentrations. BCL-2 knockdown increased cellular sensitivity to (C) daunorubicin, (D) etoposide and (E) mitoxantrone. Alternatively, priming was increased using the BCL-2 antagonist ABT-737 in the (F) THP-1 and (H) OCI-AML3 cell lines. (G) and (I) Increased priming by ABT-737 also increased these cell lines' sensitivity to etoposide, mitoxantrone and daunorubicin.
Figure 3
Figure 3. BH3 Profiling by FACS Identifies AML Myeloblasts
(A) The FACS based BH3 profiling method for primary AML starts with Ficoll gradient purification of mononuclear cells from patient blood or bone marrow. Mononuclear cells are stained with antibodies recognizing CD45, CD34 and CD38. Cells are then incubated in digitonin and peptide for 3 hours to allow the BH3 peptide time to induce mitochondrial depolarization. JC-1 dye is added to measure the remaining mitochondrial charge. AML myeloblasts are identified as CD45lo and SSClo/mid. Mitochondrial depolarization induced by peptide was detected for the AML gated cells and graphed. (B) To validate our gating, a mixed patient sample was stained with CD45 and the AML, lymphocyte and monocyte populations were gated. These populations were sorted and verified by histology. See also Figure S2.
Figure 4
Figure 4. Relative priming of AML determines clinical outcome
(A) Pre-induction priming as measured by Bim 0.1 μM depolarization of patient AML samples compared with clinical response to induction therapy specified as CR (complete response) or no CR. (B) Patients who achieve CR are separated into Cured (no relapse and no transplantation) or Relapse (relapse after initial CR). Highly primed patients having better clinical outcome. (C) Sequential samples were obtained from the same patients at two different dates. Patients who were initially obtained a CR and then relapsed and patients who never achieved a CR and had a second biopsy taken after induction. Decrease in priming for after relapse is statistically significant based on a one-tailed Wilcoxon matched-pair signed rank test with p-value 0.03. No such significant trend was observed for the refractory sequential samples. (D-F) Patients were grouped based on their ELN relapse risk factors and clinical outcome was compared with priming of primary AML samples. Patients with normal cytogenetics lacking NPM1 and FLT3 information were classified as Intermediate Risk. Significant differences were calculated using a nominal one-tailed Mann-Whitney test. (* p-value < 0.05, ** p < 0.005, *** p < 0.0005). See also Figure S3 and Table S2.
Figure 5
Figure 5. Priming of AML relative to HSC priming determines clinical outcome
(A) The priming of normal hematopoietic stem cells (HSCs) is compared with priming of Cured, Relapse, and No CR patients using a one-tailed Mann-Whitney test. (B) Kaplan-Meier survival curves based on pretreatment priming. Using the priming of normal HSCs as a cut-off, patients were categorized as high primed or low primed. Patients with AML that are high primed have significantly better overall survival than low primed patients. (C) Priming of AML subsets based on CD34 and CD38 staining of patients who did not achieve a CR. Purple region represents the average and standard deviation of normal HSC priming. All samples had a CD34+ progenitor population that was as primed or less primed than the HSCs. (** p < 0.005, *** p < 0.0005). See also Figure S4.
Figure 6
Figure 6. Allogeneic transplantation benefits patients with low priming
(A) Comparison of priming of Cured patients based on post-remission therapy. A one-tailed Mann-Whitney test is used. (B) Kaplan-Meier Survival curves based on priming and post-remission therapy. Low primed patients who received a transplant had better overall survival than no-transplanted low primed patients. Log-rank test. (**p-value<0.005)
Figure 7
Figure 7. BCL-2 independence of HSCs provides a therapeutic window for ABT-737
BH3 profiling responses to BH3 peptides show BCL-2 dependency in all AML lines. (B) Comparison of IC50 killing by ABT-737 with BAD peptide response for each line after 24 hour treatment. Correlation determined by a one-tailed Spearman correlation. (C) Most AML cells from both sensitive and refractory patients are responsive to the BAD peptide, while HSCs are not. (D) BAD peptide response of primary CD34+CD38- AML population is more pronounced than HSC response. (E) HSCs and most primary AML are not responsive to the HRK peptide. (F) HSCs are responsive to the NOXA peptide but most primary AML are not. (G) Primary AML cells are significantly more sensitive to 1 μM ABT-737 than HSCs after 9 hours treatment. Blue dots represent to low primed AML refractory to standard induction. (H) Greater ABT-737 sensitivity correlates with greater BAD BH3 peptide sensitivity and also (I) correlates with less NOXA BH3 peptide sensitivity. (* p-value <0.05, **p-value<0.005, ***p-value<0.0005; viability = Annexin V-/PI- population). See also Figure S5.

References

    1. Appelbaum FR, Gundacker H, Head DR, Slovak ML, Willman CL, Godwin JE, Anderson JE, Petersdorf SH. Age and acute myeloid leukemia. Blood. 2006;107:3481–3485. - PMC - PubMed
    1. Brunelle JK, Letai A. Control of mitochondrial apoptosis by the Bcl-2 family. J Cell Sci. 2009;122:437–441. - PMC - PubMed
    1. Brunelle JK, Ryan J, Yecies D, Opferman JT, Letai A. MCL-1-dependent leukemia cells are more sensitive to chemotherapy than BCL-2-dependent counterparts. J Cell Biol. 2009;187:429–442. - PMC - PubMed
    1. Certo M, Del Gaizo Moore V, Nishino M, Wei G, Korsmeyer S, Armstrong SA, Letai A. Mitochondria primed by death signals determine cellular addiction to antiapoptotic BCL-2 family members. Cancer Cell. 2006;9:351–365. - PubMed
    1. Chen L, Willis SN, Wei A, Smith BJ, Fletcher JI, Hinds MG, Colman PM, Day CL, Adams JM, Huang DC. Differential targeting of prosurvival Bcl-2 proteins by their BH3-only ligands allows complementary apoptotic function. Mol Cell. 2005;17:393–403. - PubMed

Publication types

MeSH terms

Substances