. 2012 Oct 25;2(4):1002-13.
doi: 10.1016/j.celrep.2012.09.009. Epub 2012 Oct 11.

A resource for manipulating gene expression and analyzing cis-regulatory modules in the Drosophila CNS

Affiliations

A resource for manipulating gene expression and analyzing cis-regulatory modules in the Drosophila CNS

Laurina Manning et al. Cell Rep. .

Abstract

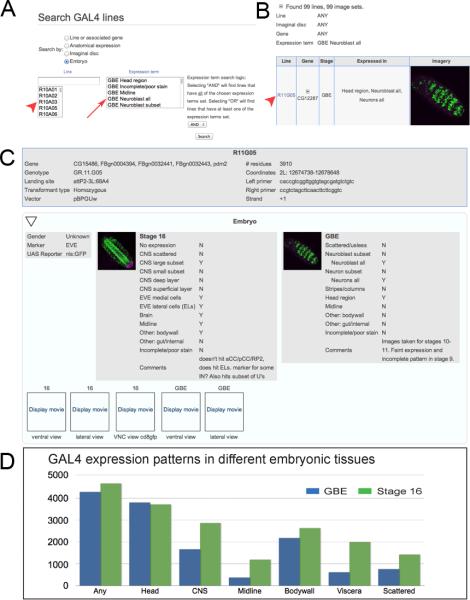
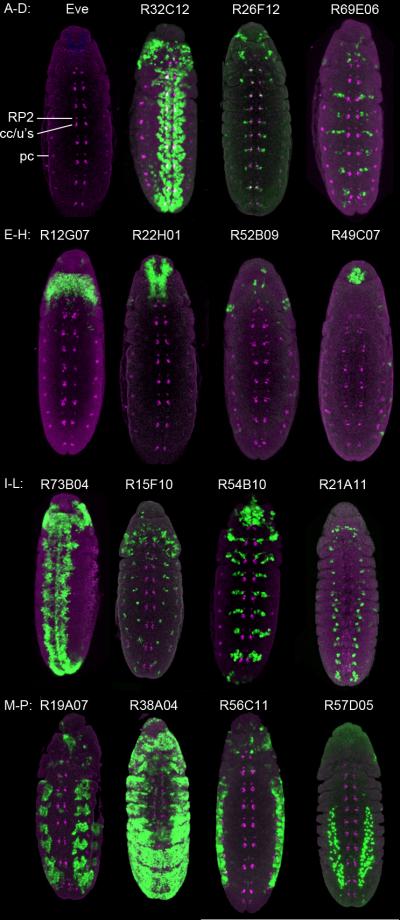
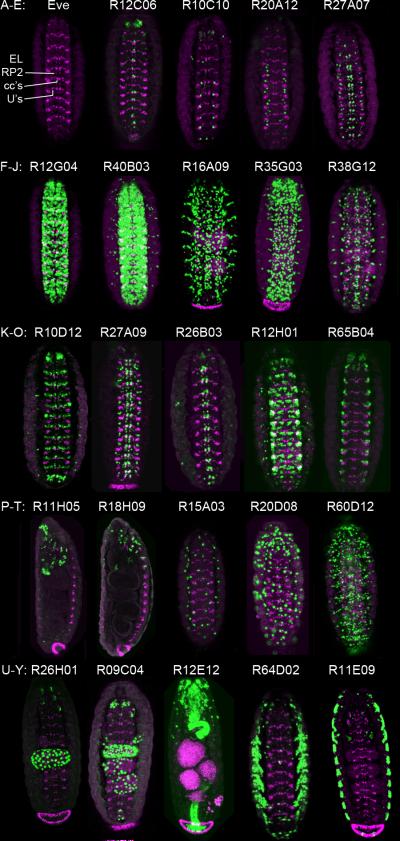
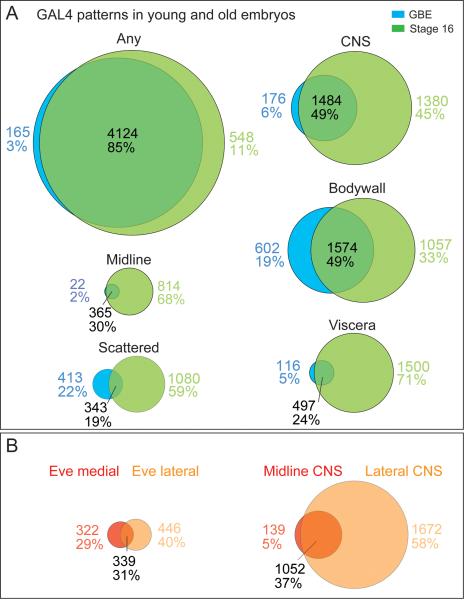
Here, we describe the embryonic central nervous system expression of 5,000 GAL4 lines made using molecularly defined cis-regulatory DNA inserted into a single attP genomic location. We document and annotate the patterns in early embryos when neurogenesis is at its peak, and in older embryos where there is maximal neuronal diversity and the first neural circuits are established. We note expression in other tissues, such as the lateral body wall (muscle, sensory neurons, and trachea) and viscera. Companion papers report on the adult brain and larval imaginal discs, and the integrated data sets are available online (http://www.janelia.org/gal4-gen1). This collection of embryonically expressed GAL4 lines will be valuable for determining neuronal morphology and function. The 1,862 lines expressed in small subsets of neurons (<20/segment) will be especially valuable for characterizing interneuronal diversity and function, because although interneurons comprise the majority of all central nervous system neurons, their gene expression profile and function remain virtually unexplored.


Figures

Figure 1
Figure 1. The GAL4 database interface
(A) Searching the GAL4 database. Searches can be done by GAL4 line name (red arrowhead) or by tissue expression (red arrow). (B) Search results. Searches using tissue expression criteria can return multiple hits (99 in this example). Each hit can be viewed by selecting the GAL4 line name (red arrowhead). (C) Information for each GAL4 line. This includes the associated genes for the line, genotype, genomic insertion site, size of cis-regulatory DNA, primers used to PCR amplify the cis-regulatory DNA (top box). It also includes gene expression data from the adult brain and ventral nerve cord (see companion papers) and the embryonic CNS at germband elongated (GBE; stages 9–12) and stage 16. For the embryonic CNS, the annotated expression patterns are given (Y = expression observed; N = no expression observed), as well as both maximum intensity projections and QuickTime movies (click “Display movie” link to play movie). Higher resolution image datasets are available upon request. (D) Histogram showing the number of GAL4 lines with the indicated expression pattern. Any = any expression in the entire embryo; Head = entire head region including brain and other cell types; CNS = ventral nerve cord from T1–A8; Midline = CNS midline cells; Bodywall = all cell types within the lateral body wall including sensory neurons, muscle, trachea, histoblasts; Viscera = internal organs excluding the CNS; Scattered = unpatterned cells in the CNS or elsewhere, including hemocytes.
Figure 2
Figure 2. Representative GAL4 expression patterns in germband elongated embryos
(A) The Even-skipped (Eve) pattern at germband elongated stages. RP2 = RP2 motoneuron; cc/u's = aCC/pCC/U1/U2 (either GMCs or neurons); pc = pericardial precursors. (B–D) Lines expressed in most neuroblasts (B) or subsets of neuroblasts (C–D). (B) Line R32C12, gene stg; (C) Line R26F12, gene grn; (D) Line R69E06, gene gsb-n. (E–H) Lines expressed in most GMCs/neurons (E) or subsets of GMCs/neurons (F–H). (E) Line R73B04, gene Sox21b; (F) Line R15F10, gene ss; (G) Line R45B10, gene pnt; (H) Line R21A11, gene eya. (I–L) Lines expressed in the head. (I) Line R12G07, gene kn; (J) Line R22H01, gene fru; (K) Line R52B09, gene gol; (L) Line R49C07, gene beat-IIIc. (M–P) Lines expressed in non-neural tissues. (M) Body wall muscle; line R19A07, gene vvl; (N) Epithelial; line R38A04, gene rst; (O) Abdominal body wall; line R56C11, gene lin-28; (P) Internal cell types; Line R57D05, gene HLH54F. All panels show ventral views of the CNS of the indicated GAL4 UAS-nGFP lines stained for Eve (magenta) and nuclear GFP (green). Anterior, top.
Figure 3
Figure 3. Representative GAL4 expression patterns in the stage 16 CNS
(A) The Even-skipped (Eve) pattern at stage 16. RP2 = RP2 motoneuron; cc's = aCC/pCC and U1/U2 neurons; U's = U3–U5 neurons; EL = Eve lateral cluster. (B–E) Lines expressed in a small subset of neurons. (A) Line R23C02, gene Adar; (B) Line R12C06, gene Oli; (C) Line R10C01, gene bi; (D) Line R20A12, gene CG16805; (E) Line R27A07, gene Fur1. (F,G) Lines expressed in large subsets of neurons. (F) Line R12G04, gene Oli; (G) Line R40B03, gene CG2672. (H–J) Lines expressed in glia. (H) Line R16A09, gene ey; (I) Line R35G03, gene Lag1; (J) Line R38G12, gene Nrt. (K–O) Lines expressed in Eve-positive neurons: K–M, in medial Eve neurons (aCC, pCC, RP2 or U1–U5); N–O, in lateral Eve neurons. (K) Line R10D12, gene Fas2; (L) Line R27A09, gene grn; (M) Line R26B03, gene grn; (N) Line R12H01, gene kn; (O) Line R65B04, gene Tk. (P–Q) Lines expressed in the brain. (P) Line R11H05, gene norpA; (Q) Line R18H09, gene wb. (R–T) Lines expressed in a scattered pattern. (R) Line R15A03, gene Syt1; (S) Line R20D08, gene cib; (T) Line R60D12, gene arm. (U–Y) Lines expressed in the gut (U–W) or lateral body wall (X–Y). (U) Line R26H01, gene lab; (V) Line R9C04, gene dac; (W) Line R12E12, gene h; (X) Line R64D02, gene 14-3-3zeta; (Y) Line R11E09, gene bi. All panels show ventral views of the stage 16 CNS, except S–U are lateral views. Eve (magenta), nuclear GFP (green), anterior, top.
Figure 4
Figure 4. Representative GAL4 expression patterns in CNS midline cells
(A–E) Images of GAL4 lines at GBE stages showing midline primordium staining of (A) all midline cells: Line R65E09, gene Tk; (B) a large subset: R33E10, gene ct; (C) a single cell: R59B03, gene CG8861; (D) a small subset of likely midline glia: Line R30C01, gene netB; and (E) a small subset of neural precursors or neurons: Line R55E07, gene CG13253. (F–J) Images of stage 16 embryos showing (F) all midline cells: Line R52C06, gene cdi; (G) midline glia: Line R30C01, gene netB; (H) iVUMs: Line R58G12, gene Gad1; (I) MNB progeny: Line R38G04, gene sca; and (J) a single neuron: Line 15F11, gene Syt1. All panels show ventral views of the CNS of the indicated GAL4 UAS-nGFP lines stained for Eve (magenta) and nuclear GFP (green). Ventral midline, arrowhead; anterior is to left.
Figure 5
Figure 5. Spatial and temporal changes in gene expression during development
(A) Venn diagrams showing the number of GAL4 lines expressed in different tissues (defined in Figure 1D legend) within early embryos (germband elongated, stages 9–12) and late embryos (stage 16). Only lines that had data for both GBE and stage 16 embryos were included. (B) Venn diagrams showing the number of GAL4 lines expressed in Eve medial and Eve lateral neurons (left) or midline and lateral CNS (right) within early embryos (germband elongated, stages 9–12) and late embryos (stage 16).

References

    1. Akiyama-Oda Y, Hosoya T, Hotta Y. Asymmetric cell division of thoracic neuroblast 6–4 to bifurcate glial and neuronal lineage in Drosophila. Development. 1999;126:1967–1974. - PubMed
    1. Artero RD, Castanon I, Baylies MK. The immunoglobulin-like protein Hibris functions as a dose-dependent regulator of myoblast fusion and is differentially controlled by Ras and Notch signaling. Development. 2001;128:4251–4264. - PubMed
    1. Baier H, Scott EK. Genetic and optical targeting of neural circuits and behavior--zebrafish in the spotlight. Curr Opin Neurobiol. 2009;19:553–560. - PMC - PubMed
    1. Barolo S. Shadow enhancers: frequently asked questions about distributed cis-regulatory information and enhancer redundancy. Bioessays. 2012;34:135–141. - PMC - PubMed
    1. Baumgardt M, Karlsson D, Terriente J, Diaz-Benjumea FJ, Thor S. Neuronal subtype specification within a lineage by opposing temporal feed-forward loops. Cell. 2009;139:969–982. - PubMed

Publication types