Review
. 2013 Jun;1834(6):1257-68.
doi: 10.1016/j.bbapap.2012.10.002. Epub 2012 Oct 11.

Advances in ion mobility spectrometry-mass spectrometry reveal key insights into amyloid assembly

Affiliations
Review

Advances in ion mobility spectrometry-mass spectrometry reveal key insights into amyloid assembly

L A Woods et al. Biochim Biophys Acta. 2013 Jun.

Abstract

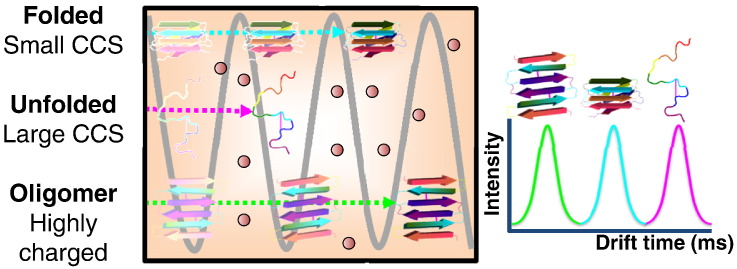
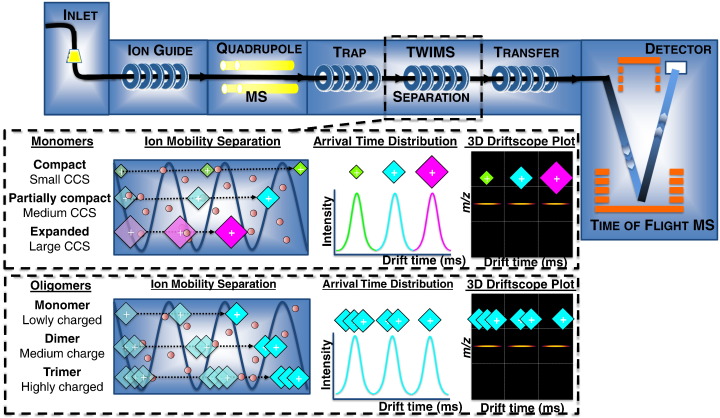
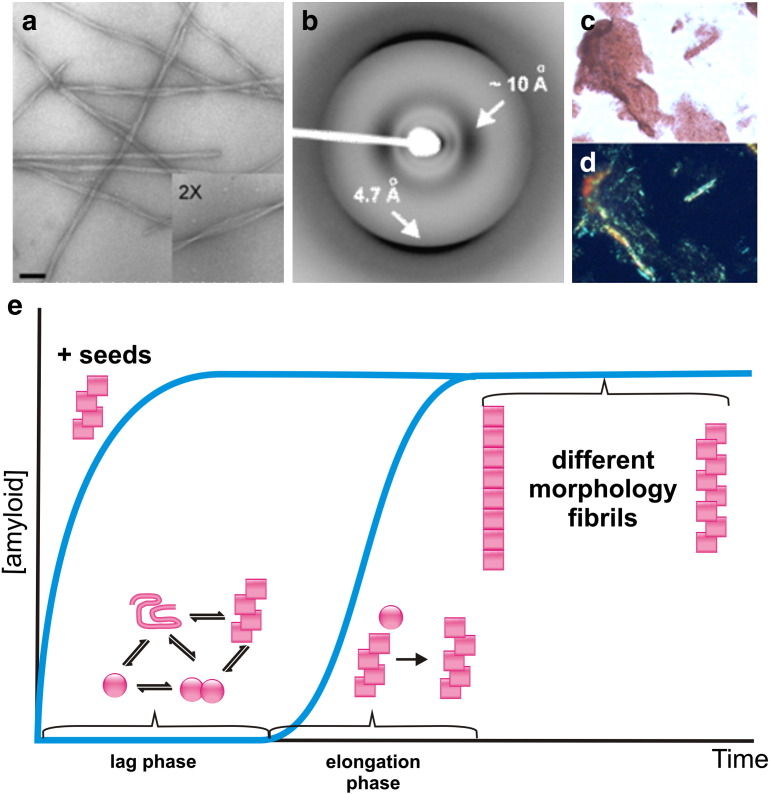
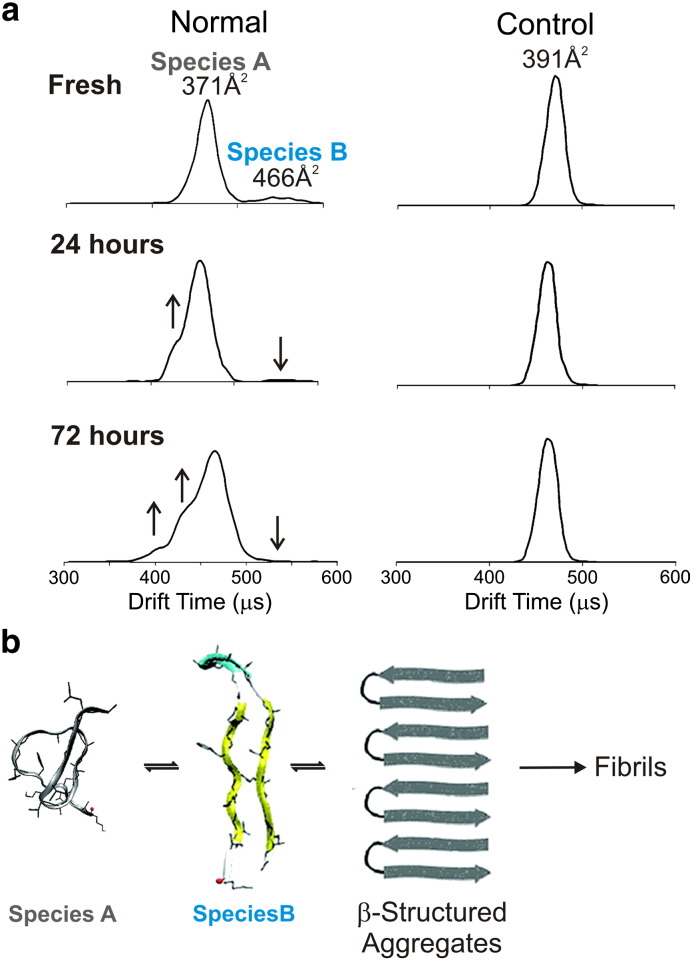
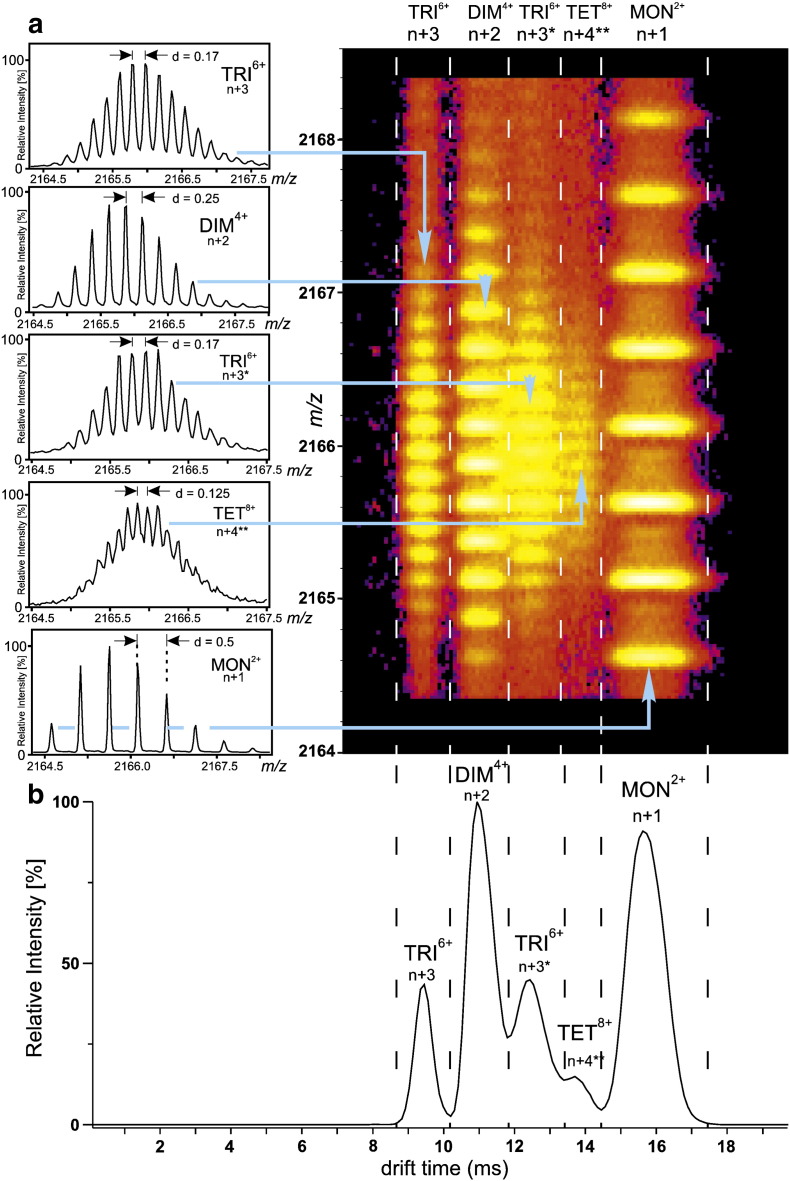
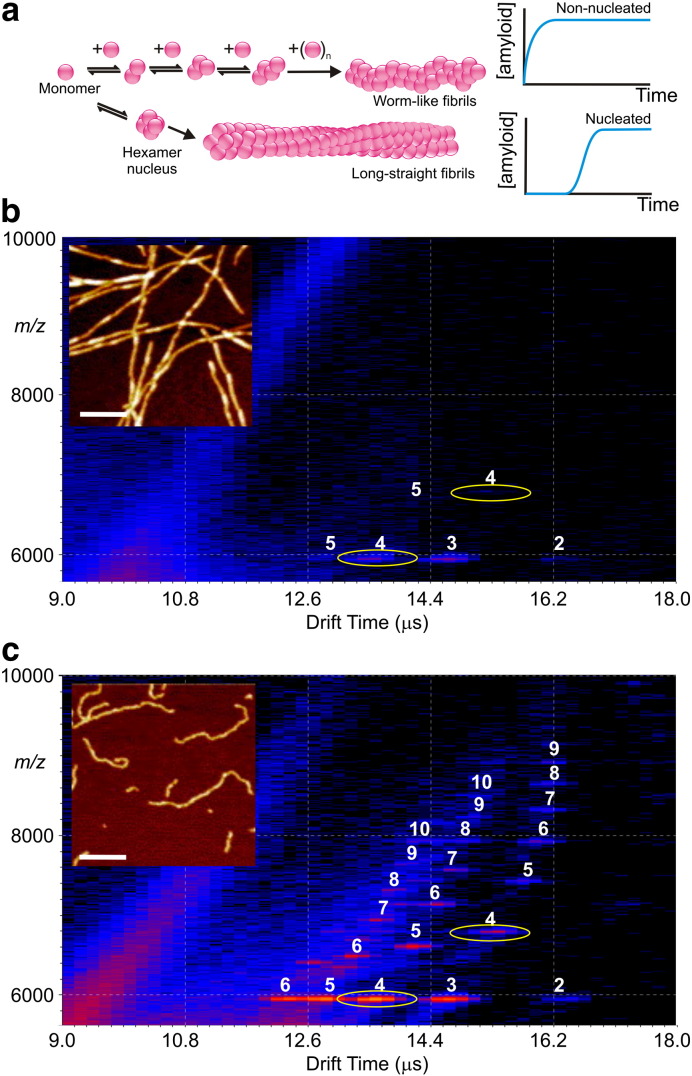
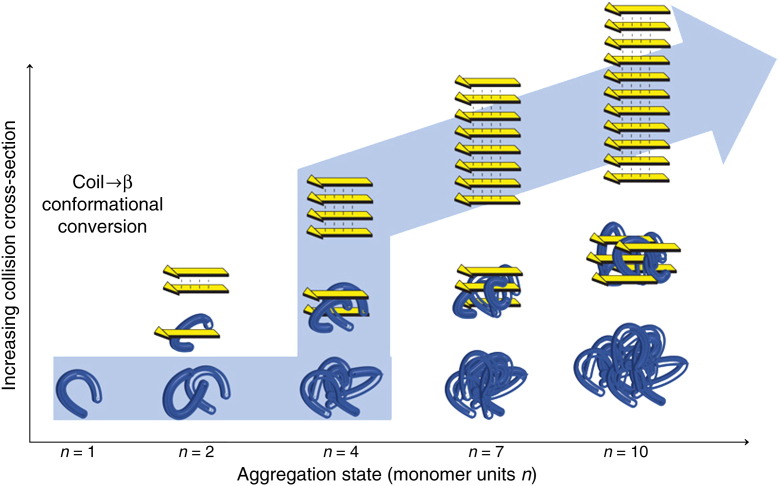
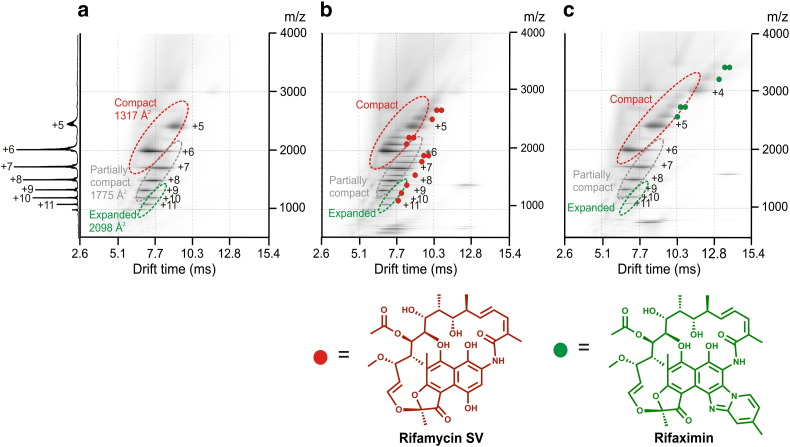
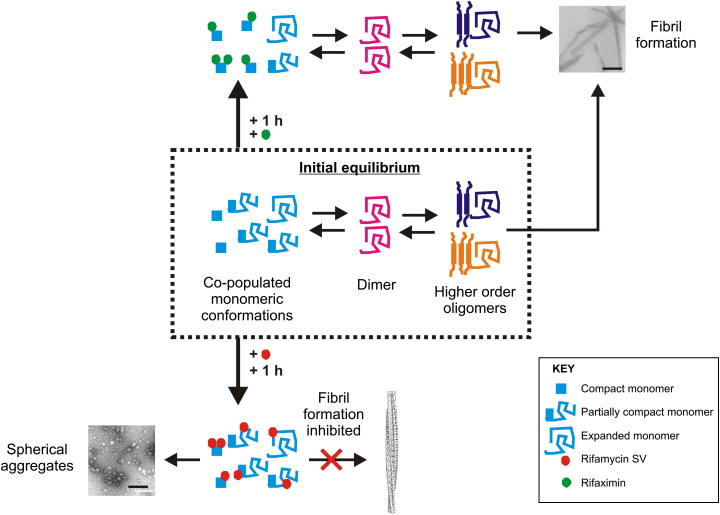
Interfacing ion mobility spectrometry to mass spectrometry (IMS-MS) has enabled mass spectrometric analyses to extend into an extra dimension, providing unrivalled separation and structural characterization of lowly populated species in heterogeneous mixtures. One biological system that has benefitted significantly from such advances is that of amyloid formation. Using IMS-MS, progress has been made into identifying transiently populated monomeric and oligomeric species for a number of different amyloid systems and has led to an enhanced understanding of the mechanism by which small molecules modulate amyloid formation. This review highlights recent advances in this field, which have been accelerated by the commercial availability of IMS-MS instruments. This article is part of a Special Issue entitled: Mass spectrometry in structural biology.


Figures

None
Graphical abstract
Fig. 1
Fig. 1
Schematic showing commercially available travelling-wave ion mobility spectrometry (TWIMS) integrated with an orthogonal acceleration quadrupole-time-of-flight mass spectrometer. Ions are separated in the TWIMS device based on their mobility through the drift cell; ions with a large collision cross-section (CCS) experience more collisions with the buffer gas molecules present in the drift cell and have a longer drift time than more compact ions of the same mass and same charge. Ions of the same m/z but different mass and different charge, for example a mixture of protein oligomers including a monomer with one charge, a dimer with two charges etc., are separated based on both their CCS and their number of charges. Typically, for a given m/z, the more highly charged ions have a shorter drift time, as they are propelled through the drift cell faster.
Fig. 2
Fig. 2
Characterisation of in vitro β2-microglobulin (β2m) amyloid fibril formation. (a) Electron microscopy image of long, straight β2m fibrils (scale bar = 100 nm); (b) X-ray fibre diffraction of long, straight β2m fibrils showing the hallmark amyloid pattern; (c) Congo red staining and (d) Congo red birefringence of β2m fibrils. (e) Schematic representation of fibril formation starting from monomer (pink circles) and proceeding via dimers and higher-order oligomers (pink squares) along seeded and unseeded assembly pathways to produce fibrils of different morphologies.
Fig. 3
Fig. 3
IMS–MS interrogation of the assembly pathway of the prion protein fragment 106–126 (PrP106–126) . (a) Ion mobility traces for the + 2 charge state monomer ions of PrP106–126 (labeled “Normal”) showing the presence of Species A (CCS = 371 Å2) together with Species B, an expanded β-sheet conformation with a CCS of 466 Å2, at early time-points. Species B is absent in the “Control” sample, a non-amyloidogenic peptide of the same amino acid composition but with a scrambled sequence (CCS = 391 Å2). The population of expanded conformers in the “Normal” PrP106–126 decreases over time as species with drift times of 390 μs (CCS = 302 Å2) and 425 μs (CCS = 347 Å2) appear (see arrows). These peaks are presumed to be oligomeric as the CCS values are too small to belong to a monomeric conformer with + 2 charges. (b) Schematic showing the proposed mechanism of PrP106–126 oligomer formation involving the assembly of Species A and Species B into ordered small aggregates.
Fig. 4
Fig. 4
40 oligomers separated and identified by travelling-wave IMS–MS . (a) Three-dimensional IMS–MS spectrum of Aβ40 for the m/z 2164–2168 region containing overlapping charge states arising from monomeric (MON), dimeric (DIM), trimeric (TRI) and tetrameric (TET) Aβ40. m/z values are shown on the vertical axis and ion mobility drift times (ms) on the horizontal axis. The signal amplitude is colour-coded, increasing from purple (low intensity) to bright yellow (high intensity). The insets show the isotopic patterns of the IMS-separated + 2 monomer ions, + 4 dimer ions, + 6 trimer ions and + 8 tetramer ions, all of the same m/z value, from which the oligomers can be identified unambiguously. Note there are two trimers with different drift-times, the one with the higher mobility and shorter drift time being the more compact of the two. (b) Summary of the oligomer composition of the m/z 2164–2168 region following assignment of each species based on its C13 isotope distribution, demonstrating the presence of two different Aβ40 trimers and showing clearly the drift times (ms) of each oligomeric state.
Fig. 5
Fig. 5
In vitro fibril formation from β2-microglobulin (β2m) monitored in real-time by travelling-wave IMS–MS. (a) Schematic showing two assembly pathways which diverge to form worm-like fibrils (non-nucleated assembly) or long-straight fibrils (nucleated assembly following a lag-phase). (b) Three-dimensional IMS–MS spectrum (m/z 6000–10,000) showing β2m oligomers 1 min into fibril assembly in 100 mM ammonium formate buffer (pH 2.5), which triggers the formation of long-straight fibrils. (c) Three-dimensional IMS–MS spectrum (m/z 6000–10,000) showing β2m oligomers 1 min into fibril assembly in 400 mM ammonium formate buffer (pH 2.5) which triggers the formation of worm-like fibrils. In both (b) and (c) the numbers above each peak indicate the oligomer size. The + 7 and + 8 charge state ions of the tetramer are highlighted (yellow ovals) in each case to show the increase in their population with increasing ionic strength denoting the point at which the pathways of assembly are thought to diverge. Insets show atomic force microscopy images of the fibrils formed at the end-points of assembly in each case; the scale bars represent 200 nm.
Fig. 6
Fig. 6
The in vitro self-assembly of peptide monomers into mature, insoluble β-sheet fibrils via an intermediate phase of soluble oligomers monitored by IMS–MS . Self-assembly starts at the folded monomer (n = 1, left) and proceeds to soluble peptide assemblies of increasing mass (n = 2, 4, 7, and 10). Soluble peptide oligomers with identical mass (i.e. the same number of monomer units, n) can assume different conformations such as globular (blue structure, bottom) or β-strand conformations (yellow arrows, top) with different CCS. Successively mass-extracting a specific aggregation state from the solution-phase distribution and subsequent determination of its CCS reveals the self-assembly pathway taking place in solution (large, pale blue arrow). A pronounced transition of soluble oligomers (horizontal axis) from globular conformations into β-strand structures occurs during this phase. The oligomer size at which the divergence from compact to extended conformers occurs differs for peptides of different sequences.
Fig. 7
Fig. 7
Small molecule inhibition of β2m fibril formation in vitro . Three-dimensional IMS–MS spectra of (a) β2m monomer alone; (b) β2m with equimolar rifamycin SV added; and (c) β2m with equimolar rifaximin added. The numbers adjacent to the peaks (e.g. + 5) indicate the charge state carried by those ions, and charge states belonging to the same protein conformers are encircled with dashed lines and labeled individually: compact, partially compact, and expanded. The filled coloured circles on the spectra represent the number of ligand molecules bound to each charge state of β2m in the different spectra (red for rifamycin SV, green for rifaximin). (b) Rifamycin SV binds to all charge states and hence all conformers of monomeric β2m, thereby inhibiting fibril formation. (c) Rifaximin binds only to the compact protein conformer but not the partially compact or the expanded conformers, and does not inhibit fibril formation. The summed m/z spectrum for β2m (11,860 Da) alone is shown on the left-hand side of (a). The molecular structures of rifamycin SV and rifaximin are positioned below the relevant spectra in (b) and (c), respectively.
Fig. 8
Fig. 8
Schematic showing small molecule inhibition of β2m fibril formation in vitro . The initial protein equilibrium consists of a mixture of monomeric protein conformers (compact, partially compact, and extended) together with protein dimer and some higher order oligomers. Rifamycin SV binds to the compact, partially compact and expanded conformers of β2m, inhibiting fibril formation and diverting assembly to spherical aggregates. Rifaximin, however, binds only to the compact conformer of β2m, but not to the partially compact or the extended conformers, and does not prevent β2m from undergoing self-aggregation to form fibrils.

References

    1. Dole M., Mack L.L., Hines R.L., Mobley R.C., Ferguson L.D., Alice M.B. Molecular beams of macroions. J. Chem. Phys. 1968;49:2240–2249.
    1. Fenn J.B., Mann M., Meng C.K., Wong S.F., Whitehouse C.M. Electrospray ionization for mass spectrometry of large biomolecules. Science. 1989;246:64–71. - PubMed
    1. Karas M., Hillenkamp F. Laser desorption ionization of proteins with molecular masses exceeding 10,000 daltons. Anal. Chem. 1988;60:2299–2301. - PubMed
    1. Chowdhury S.K., Katta V., Chait B.T. Probing conformational changes in proteins by mass spectrometry. J. Am. Chem. Soc. 1990;112:9012–9013.
    1. Smith R.D., Light-Wahl K.J. The observation of non-covalent interactions in solution by electrospray ionization mass spectrometry: promise, pitfalls and prognosis. Biol. Mass Spectrom. 1993;22:493–501.

Publication types

MeSH terms

LinkOut - more resources