. 2012 Nov;122(11):4094-104.
doi: 10.1172/JCI64115. Epub 2012 Oct 15.

TNF signaling drives myeloid-derived suppressor cell accumulation

Affiliations

TNF signaling drives myeloid-derived suppressor cell accumulation

Xueqiang Zhao et al. J Clin Invest. 2012 Nov.

Abstract

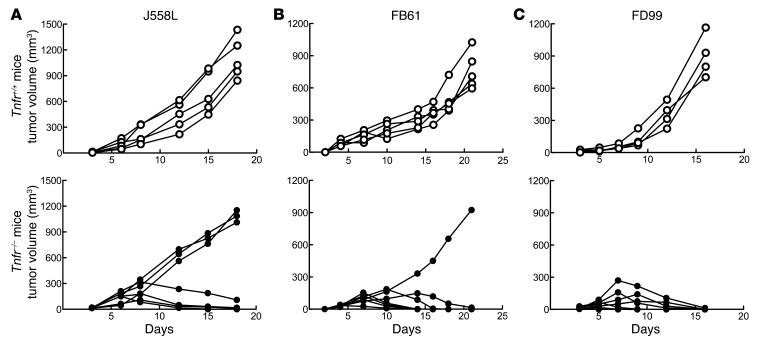
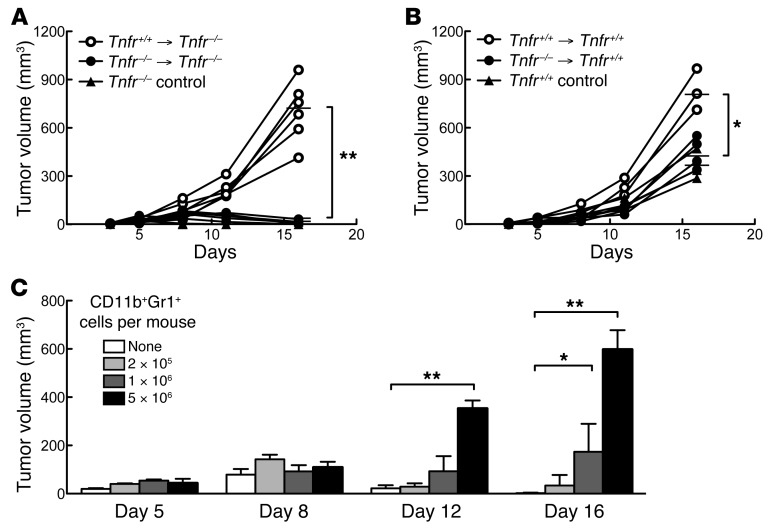
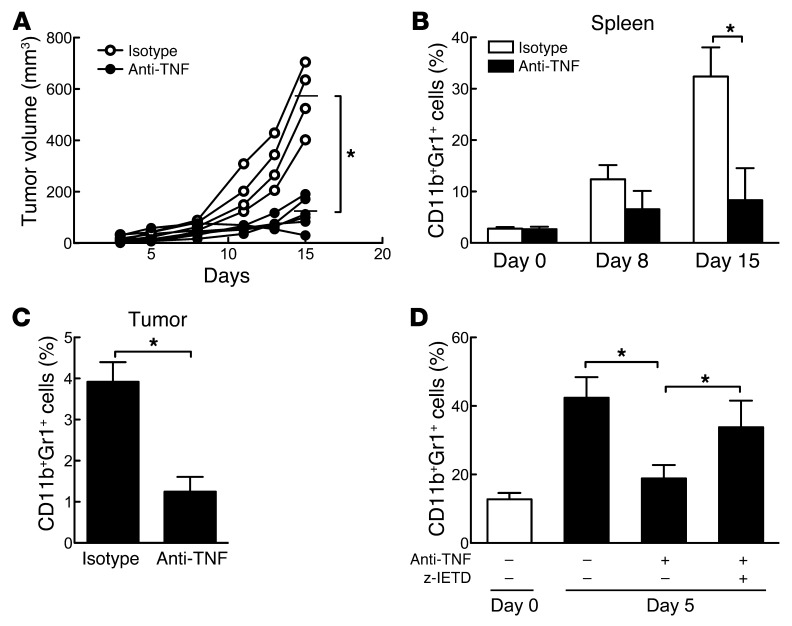
TNF, an inflammatory cytokine that is enriched in the tumor microenvironment, promotes tumor growth and subverts innate immune responses to cancer cells. We previously reported that tumors implanted in TNF receptor-deficient (Tnfr-/-) mice are spontaneously rejected; however, the molecular mechanisms underlying this rejection are unclear. Here we report that TNF signaling drives the peripheral accumulation of myeloid-derived suppressor cells (MDSCs). MDSCs expand extensively during inflammation and tumor progression in mice and humans and can enhance tumor growth by repressing T cell-mediated antitumor responses. Peripheral accumulation of MDSCs was drastically impaired in Tnfr-/- mice. Signaling of TNFR-2, but not TNFR-1, promoted MDSC survival through upregulation of cellular FLICE-inhibitory protein (c-FLIP) and inhibition of caspase-8 activity. Loss of TNFRs impaired the induction of MDSCs from bone marrow cells, but this could be reversed by treatment with caspase inhibitors. These results demonstrate that TNFR-2 signaling promotes MDSC survival and accumulation and helps tumor cells evade the immune system.


Figures

Figure 1
Figure 1. Transplanted tumors are spontaneously rejected in Tnfr–/– mice.
Tnfr+/+ (n = 4–5) and Tnfr–/– (n = 7) mice were subcutaneously injected with (A) 5 × 10⁶ J558L cells, (B) 1 × 10⁶ FB61 cells, or (C) 1 × 10⁶ FD99 cells. Tumor volumes after tumor cell inoculation are shown; each line represents the growth curve of a tumor in a single mouse. Similar results were obtained from 2 other independent experiments.
Figure 2
Figure 2. Peripheral accumulation of CD11b+Gr1+ cells is impaired in Tnfr–/– mice.
(A) Tnfr+/+ and Tnfr–/– mice were subcutaneously injected with 1 × 10⁶ FB61 cells or PBS as control. 8–10 days after tumor cell inoculation, single splenocytes were stained for CD11b and Gr1 and assessed by flow cytometry. Left: Gated CD11b+Gr1+ cells. Right: Percent CD11b+Gr1+ cells in tumor-bearing Tnfr+/+ and Tnfr–/– mice and corresponding controls. Bars denote means. **P < 0.01. (B) Absolute number of CD11b+Gr1+ cells in spleens of tumor-bearing mice and corresponding controls. Data are mean ± SEM. *P < 0.05. (C and D) Percent CD11b+Gr1+ cells relative to total cells for (C) peripheral blood and (D) tumor tissues. n = 5 per group. Data are mean ± SEM. *P < 0.05. (E) CD11b+ and Gr1+ cells in tumor and spleen sections of Tnfr+/+ and Tnfr–/– mice were visualized by immunofluorescence staining. Nuclei were counterstained with DAPI. Images are representative of at least 3 mice per group. Original magnification, ×200 (tumor); ×100 (spleen). Scale bars: 300 μm. (F) Spleen cells as above were stained for flow cytometry analysis. Unstained Tnfr+/+ splenocytes were used as a control.
Figure 3
Figure 3. Adoptive transfer of Tnfr+/+ CD11b+Gr1+ cells restores tumor growth in Tnfr–/– mice in a dose-dependent manner.
(A and B) Purified Tnfr+/+ or Tnfr–/– CD11b+Gr1+ cells (5 × 10⁶) were intravenously injected into Tnfr–/– (A; n = 5–6) or Tnfr+/+ (B; n = 3–4) mice. Untreated mice served as controls. 12 hours later, mice were subcutaneously injected with 1 × 10⁶ FB61 cells. Shown are tumor volumes after tumor cell inoculation. Lines represent growth curves of a tumor in a single mouse; bars denote mean tumor size of each group at day 16. *P < 0.05; **P < 0.01. (C) Tnfr–/– mice were adoptively transferred without or with 2 × 10⁵, 1 × 10⁶, or 5 × 10⁶ purified Tnfr+/+ CD11b+Gr1+ cells by intravenous injection; 12 hours later, they were injected subcutaneously with 1 × 10⁶ FB61 cells. Tumor volumes are presented as mean ± SEM. n = 5 or 7 per group. *P < 0.05; **P < 0.01.
Figure 4
Figure 4. Enhanced caspase-8 activity is responsible for the impaired accumulation of CD11b+Gr1+ cells in Tnfr–/– mice.
(A) Tnfr+/+ and Tnfr–/– mice were intraperitoneally injected with 1 mg BrdU 3, 5, and 8 days after FB61 inoculation. After an additional 24 hours, CD11b+Gr1+ cells in total bone marrow cells were gated (left), and BrdU incorporation was determined (right). Numbers indicate percent BrdU+ cells in gated cells. n = 5 per group. (B) Spleen cells were prepared 8–10 days after FB61 cell inoculation and stained for CD11b, Gr1, and annexin V. Numbers denote percent annexin V+ cells in gated CD11b+Gr1+ cells. (C) Proportion of annexin V+CD11b+Gr1+ cells, expressed as percent of total CD11b+Gr1+ cells (mean ± SEM). n = 3 per group. **P < 0.01. (D) Splenic CD11b+Gr1+ cells from tumor-bearing Tnfr+/+ and Tnfr–/– mice were lysed, and caspase-8 activities were determined by colorimetric activity assay (mean ± SEM). n = 3–5 per group. **P < 0.01. (E) Total cell lysates were subjected to cleaved caspase-8–specific Western blot. β-actin served as internal control. (F) MDSCs were in vitro induced from Tnfr+/+ and Tnfr–/– bone marrow cells. 6 hours later, z-VAD, z-IETD, or DMSO (as control) was added to the medium. Data (mean ± SEM) denote percent CD11b+Gr1+ cells in total living cells in the culture. *P < 0.05.
Figure 5
Figure 5. NF-κB–mediated c-FLIP expression is downregulated in Tnfr–/– MDSCs.
(A) CD11b+Gr1+ cells were freshly isolated from Tnfr+/+ and Tnfr–/– tumor-bearing mice. Amounts of c-FLIP or Bcl-xL mRNA were determined by real-time RT-PCR and are shown relative to β-actin mRNA (mean ± SEM). *P < 0.05. (B) Total cell lysates were extracted from purified Tnfr+/+ and Tnfr–/– MDSCs. Levels of c-FLIP, cleaved caspase-8, and Bcl-xL were determined by Western blot. β-actin served as internal control. (C) Purified MDSCs were stimulated with 20 ng/ml TNF for the indicated times. Levels of p–NF-κB p65, p-IκBα, and p-IKKα/β, as well as c-FLIP and cleaved caspase-8, were determined from total cell lysates by Western blot. β-actin served as internal control. Representative images are shown for 3 independent experiments.
Figure 6
Figure 6. TNFR-2 signaling maintains survival of CD11b+Gr1+ cells.
(A) Tnfr+/+, Tnfr1–/–, Tnfr2–/–, and Tnfr–/– mice were subcutaneously injected with 1 × 10⁶ FB61 cells. Tumor volumes were measured after tumor cell inoculation (mean ± SEM). n = 5–7 per group. *P < 0.05. (B) Spleen cells were prepared 8–10 days after tumor cell inoculation, stained for CD11b and Gr1, and analyzed by flow cytometry. Data (mean ± SEM) represent percent CD11b+Gr1+ cells of total spleen cells. *P < 0.05. (C) Accumulation of CD11b+ and Gr1+ cells in the spleen of tumor-bearing mice, determined by immunofluorescence staining (see Methods). Dotted outlines denote germinal centers. Images are representative of at least 3 mice. Original magnification, ×100 (CD11b); ×200 (Gr1). Scale bars: 300 μm. (D) Total cell lysates were prepared from isolated Tnfr1–/– and Tnfr2–/– CD11b+Gr1+ cells after stimulation with 20 ng/ml TNF for the indicated times. Levels of TRAF2, p–NF-κB p65, p-IκBα, and p-IKKα/β, c-FLIP, and cleaved caspase-8 were determined by Western blot. See Figure 5C for expression levels of respective molecules in Tnfr+/+ mice (controls). β-actin was used as an internal control. Representative images are shown for 3 independent experiments.
Figure 7
Figure 7. Neutralization of endogenous TNF impairs transplanted tumor growth and peripheral accumulation of CD11b+Gr1+ cells.
(A) Tnfr+/+ mice were intraperitoneally injected with the TNF-neutralizing mAb V1q (n = 6) or isotype control mAb (n = 4) 2 days prior to subcutaneous injection of 1 × 10⁶ FB61 cells. mAb injection was repeated 3 and 8 days after tumor cell inoculation. Each line represents the growth curve of a tumor in a single mouse; bars denote mean tumor size of each group at day 15. *P < 0.05. (B and C) Spleen or tumor cells were isolated after tumor cell inoculation and stained for flow cytometry. Shown are percent CD11b+Gr1+ cells in (B) total spleen cells and (C) total tumor cells at days 8–10 (mean ± SEM). n = 3–5 per group. *P < 0.05. (D) Bone marrow cells isolated from Tnfr+/+ mice were induced for MDSC generation in vitro (see Methods). V1q, z-IETD, or DMSO (as control) was added to the culture after 6 hours. Cells were collected 5 days later and stained for CD11b and Gr1. Data (mean ± SEM) represent percent CD11b+Gr1+ cells within total living cells in the culture. *P < 0.05.

References

    1. Mantovani A, Allavena P, Sica A, Balkwill F. Cancer-related inflammation. Nature. 2008;454(7203):436–444. doi: 10.1038/nature07205. - DOI - PubMed
    1. Hanahan D, Weinberg RA. Hallmarks of cancer: the next generation. Cell. 2011;144(5):646–674. doi: 10.1016/j.cell.2011.02.013. - DOI - PubMed
    1. Pekarek LA, Starr BA, Toledano AY, Schreiber H. Inhibition of tumor growth by elimination of granulocytes. J Exp Med. 1995;181(1):435–440. doi: 10.1084/jem.181.1.435. - DOI - PMC - PubMed
    1. Gabrilovich DI, Nagaraj S. Myeloid-derived suppressor cells as regulators of the immune system. Nat Rev Immunol. 2009;9(3):162–174. - PMC - PubMed
    1. Serafini P, et al. Derangement of immune responses by myeloid suppressor cells. Cancer Immunol Immunother. 2004;53(2):64–72. doi: 10.1007/s00262-003-0443-2. - DOI - PMC - PubMed

Publication types

MeSH terms

Substances