. 2012 Oct 23;109(43):17454-9.
doi: 10.1073/pnas.1213530109. Epub 2012 Oct 11.

Transcriptional burst frequency and burst size are equally modulated across the human genome

Affiliations

Transcriptional burst frequency and burst size are equally modulated across the human genome

Roy D Dar et al. Proc Natl Acad Sci U S A. .

Abstract

Gene expression occurs either as an episodic process, characterized by pulsatile bursts, or as a constitutive process, characterized by a Poisson-like accumulation of gene products. It is not clear which mode of gene expression (constitutive versus bursty) predominates across a genome or how transcriptional dynamics are influenced by genomic position and promoter sequence. Here, we use time-lapse fluorescence microscopy to analyze 8,000 individual human genomic loci and find that at virtually all loci, episodic bursting--as opposed to constitutive expression--is the predominant mode of expression. Quantitative analysis of the expression dynamics at these 8,000 loci indicates that both the frequency and size of the transcriptional bursts varies equally across the human genome, independent of promoter sequence. Strikingly, weaker expression loci modulate burst frequency to increase activity, whereas stronger expression loci modulate burst size to increase activity. Transcriptional activators such as trichostatin A (TSA) and tumor necrosis factor α (TNF) only modulate burst size and frequency along a constrained trend line governed by the promoter. In summary, transcriptional bursting dominates across the human genome, both burst frequency and burst size vary by chromosomal location, and transcriptional activators alter burst frequency and burst size, depending on the expression level of the locus.


Conflict of interest statement

The authors declare no conflict of interest.

Figures
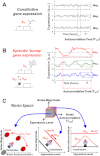
Fig. 1.
Fig. 1.
Fluctuations in gene expression to differentiate between alternate models of transcription across the genome. (A and B) Schematics of the constitutive, Poisson-expression model and the episodic, bursty gene-expression model, together with three expression trajectories from hypothetical genomic loci. Sites that exhibit constitutive (i.e., Poisson) expression exhibit small and relatively fast fluctuations in gene products over time. Alternatively, loci that exhibit episodic expression bursts generate large, slow fluctuations in gene expression. (C) The principle of noise space. The three-dimensional noise space consists of noise magnitude, noise autocorrelation, and mean expression level. Small, fast fluctuations have a small noise magnitude and short autocorrelation times and thus cluster (after normalization) at the origin of the noise magnitude-autocorrelation plane (gray region, Lower Left). Large, slow (i.e., bursty) fluctuations have expanded noise magnitude and extended autocorrelation times (red ovals). The three-dimensional space can be decomposed into two additional two-dimensional projections of noise magnitude and noise autocorrelation versus mean expression level (Lower Center and Lower Right). For episodic-bursty expression, a trajectory’s noise-space coordinates are invariably shifted away from the constitutive model into the burst model space depending on changes to their transcriptional parameters (10).
Fig. 2.
Fig. 2.
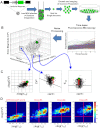
Extracting transcriptional parameters from the noise space. In individual isoclones, burst dynamics vary with genomic location. (A) Cells are infected with a lentiviral vector expressing a 2-h half-life GFP reporter (d2GFP) at a low multiplicity of infection (moi) to ensure a single semirandom integration in each cell. Individual single cells are isolated, grown (creating isoclone populations), and imaged by time-lapse fluorescence microscopy. (B and C) Single-cells are tracked for 12–18 h, and an individual cell’s mean expression level, variance (σ2), and autocorrelation time (τ1/2) are extracted from the time trace (e.g., the green circle represents a single cell’s noise space coordinate). A constitutive model of gene expression that displays abundance dependence (bold red arrows from black model lines) was used to normalize each cell’s noise magnitude (CV2) and autocorrelation (τ1/2). The normalized noise magnitudes and autocorrelations are plotted in a Δ log CV2 - Δ log τ1/2 noise map (Left). (D) Consistent shifts to the Upper Right quadrant in Δ log CV2 - Δ log τ1/2 space observed for three LTR isoclones (clones 3, 4, and 5), are indicative of transcriptional bursting relative to the least bursty isoclones (clones 1 and 2). Bursting dynamics varies between different clones as evidenced by shifts in both noise autocorrelation and magnitude. The isoclonal signature is taken from 18 h trajectories of 400 cells.
Fig. 3.
Fig. 3.
Episodic-bursty expression dominates across the human genome. (A) To create the polyclonal population, cells are infected with a lentiviral vector expressing d2GFP so that each cell represents a unique clone harboring a single semirandom integration of reporter. (B) Resultant noise maps for over 8,000 individual cell trajectories for the HIV-1 LTR promoter, EF1A promoter, and UBC promoter. The constitutive origin is derived from Fig. 2D (18 h).
Fig. 4.
Fig. 4.
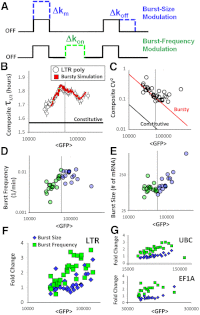
Transcriptional burst frequency and burst size vary equally across the genome and are strongly dependent on expression level. (A) Schematic of the two-state model of transcriptional bursting, where the promoter switches between ON and OFF states at rates kon and koff and transcribes at rate km in the ON state. Transcriptional dynamics are modulated through changes in burst size, burst frequency, or both. (B) Noise autocorrelation, noise magnitude (C), burst frequency (D), and burst size (E) versus abundance for polyclonal subclusters of 2,000 12-h Ld2G single-cell trajectories. Low and high abundance domains are separated by a solid gray threshold line which indicates the changes in the trends of noise autocorrelation, noise magnitude, and hence burst size and burst frequency is observed. (F and G) As a function of formula image, fold changes in burst size and frequency are comparable, with an initial increase of frequency in all promoters investigated.
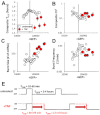
Fig. 5.
Fig. 5.
Transcriptional burst size and frequency are altered by transcriptional activators. (AD) TNF addition (filled red circles) shifts the measured integration sites to the higher abundance and burst dynamic domain along the nondrug curve (empty circles). Large autocorrelation shifts implicate changes in burst kinetics. (E) Estimated residence times in the active (ON) and inactive (OFF) states.

References

    1. Taniguchi Y, et al. Quantifying E. coli proteome and transcriptome with single-molecule sensitivity in single cells. Science. 2010;329:533–538. - PMC - PubMed
    1. Yunger S, Rosenfeld L, Garini Y, Shav-Tal Y. Single-allele analysis of transcription kinetics in living mammalian cells. Nat Methods. 2010;7:631–633. - PubMed
    1. Golding I, Paulsson J, Zawilski SM, Cox EC. Real-time kinetics of gene activity in individual bacteria. Cell. 2005;123:1025–1036. - PubMed
    1. Pedraza JM, Paulsson J. Effects of molecular memory and bursting on fluctuations in gene expression. Science. 2008;319:339–343. - PubMed
    1. Cai L, Friedman N, Xie XS. Stochastic protein expression in individual cells at the single molecule level. Nature. 2006;440:358–362. - PubMed

Publication types