. 2013 Feb;23(2):377-87.
doi: 10.1101/gr.138545.112. Epub 2012 Oct 11.

SeqFold: genome-scale reconstruction of RNA secondary structure integrating high-throughput sequencing data

Affiliations

SeqFold: genome-scale reconstruction of RNA secondary structure integrating high-throughput sequencing data

Zhengqing Ouyang et al. Genome Res. 2013 Feb.

Abstract

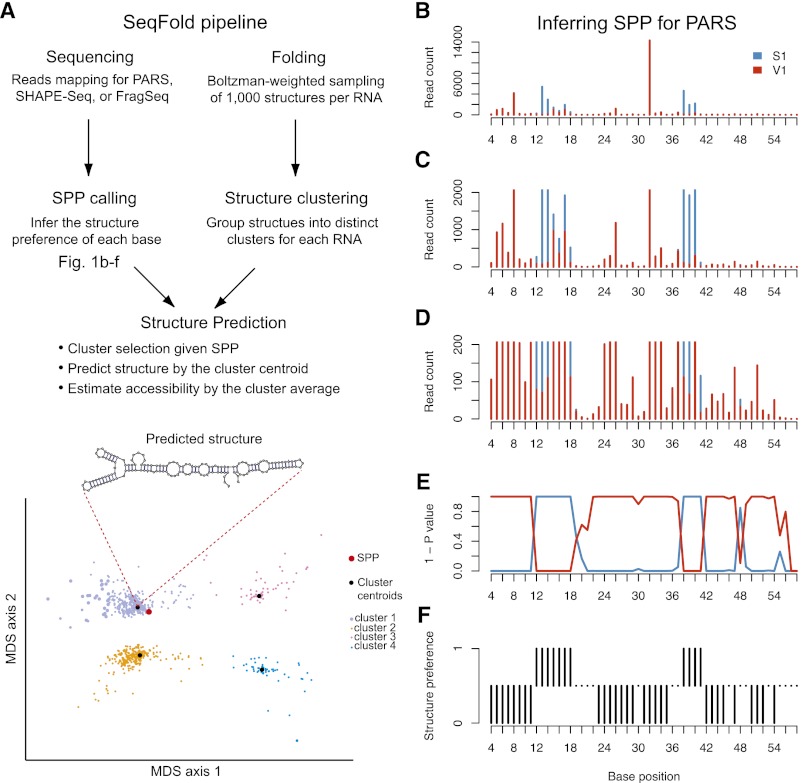
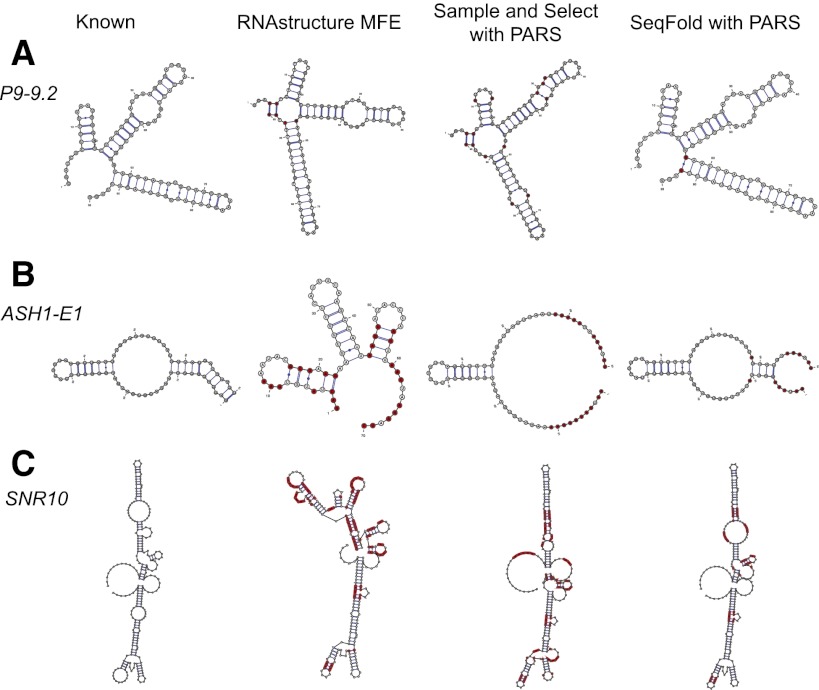
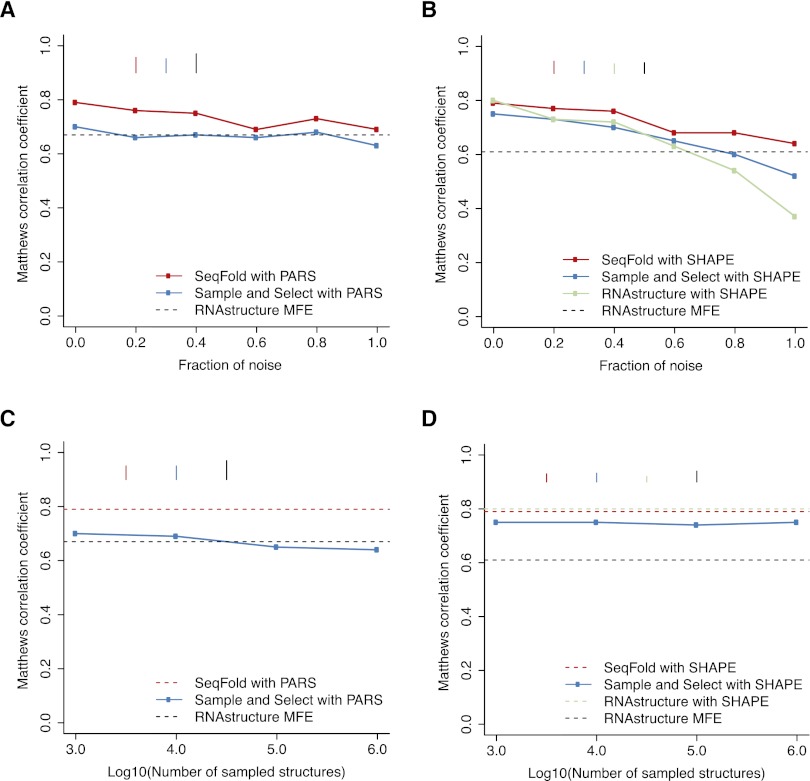
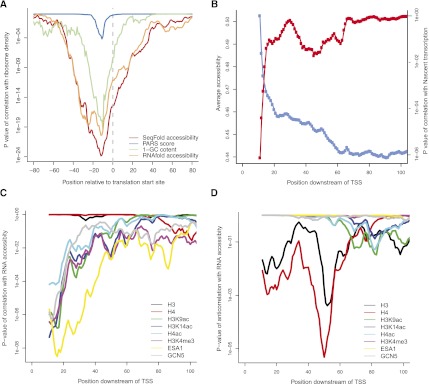
We present an integrative approach, SeqFold, that combines high-throughput RNA structure profiling data with computational prediction for genome-scale reconstruction of RNA secondary structures. SeqFold transforms experimental RNA structure information into a structure preference profile (SPP) and uses it to select stable RNA structure candidates representing the structure ensemble. Under a high-dimensional classification framework, SeqFold efficiently matches a given SPP to the most likely cluster of structures sampled from the Boltzmann-weighted ensemble. SeqFold is able to incorporate diverse types of RNA structure profiling data, including parallel analysis of RNA structure (PARS), selective 2'-hydroxyl acylation analyzed by primer extension sequencing (SHAPE-Seq), fragmentation sequencing (FragSeq) data generated by deep sequencing, and conventional SHAPE data. Using the known structures of a wide range of mRNAs and noncoding RNAs as benchmarks, we demonstrate that SeqFold outperforms or matches existing approaches in accuracy and is more robust to noise in experimental data. Application of SeqFold to reconstruct the secondary structures of the yeast transcriptome reveals the diverse impact of RNA secondary structure on gene regulation, including translation efficiency, transcription initiation, and protein-RNA interactions. SeqFold can be easily adapted to incorporate any new types of high-throughput RNA structure profiling data and is widely applicable to analyze RNA structures in any transcriptome.


Figures

Figure 1.
Figure 1.
Framework of the SeqFold method. (A) The flowchart of integrated prediction of RNA secondary structure. On one hand, sequencing reads that contain RNA structure information are mapped, followed by the inference of structure preference for each base. The structure preferences of all informative bases of a transcript define the structure preference profile (SPP). On the other hand, 1000 structures per transcript are generated from the Sfold Boltzman sampling procedure and grouped into distinct clusters (Ding and Lawrence 2003; Ding et al. 2005, 2006). At the structure prediction stage, nearest neighbor classification is used to identify a specific structure cluster given an SPP. The centroid of the selected cluster is taken as the predicted structure and the average of the sample structures in the cluster gives the accessibility of each base. The bottom panel demonstrates the clustering pattern in the multidimensional scaling surface. (BF) Illustration of the SPP calling process for PARS. (B) The read counts of RNase S1 and V1 along the P9-9.2 domain of the Tetrahymena ribozyme (Guo et al. 2004). C as B showing a maximal read count of 2000. D as B showing a maximal read count of 200. (E) The (1 - P-value) profile of hypergeometric test for each base. (F) Structure preference calls with FDR 0.05.
Figure 2.
Figure 2.
Comparison of RNA secondary structure prediction methods with PARS data. For each RNA, the reference secondary structure, the RNAstructure MFE prediction, the “sample and select” prediction with PARS, and the SeqFold prediction with PARS are shown. (A) The P9-9.2 domain of the Tetrahymena ribozyme (Guo et al. 2004). (B) The E1 domain of the ASH1 mRNA (Chartrand et al. 2002). (C) The noncoding RNA SNR10. In the case that the “sample and select” algorithm outputs alternative structure models, the one most matching the reference structures is presented. For each predicted secondary structure, the red bases correspond to errors compared to the reference structures.
Figure 3.
Figure 3.
Comparison of the robustness of RNA secondary structure prediction methods on PARS and SHAPE data. (A) The mean prediction accuracy measured by Matthews correlation coefficient (MCC) for RNAstructure MFE, “sample and select,” and SeqFold with increasing fractions of PARS data being replaced by randomized signals. (B) The mean MCC for RNAstructure MFE, RNAstructure pseudo-energy, “sample and select,” and SeqFold with increasing fractions of SHAPE data being replaced by randomized signals. (C) The mean MCC of the “sample and select” predictions for PARS data by sampling structures in the order of 1000, 10,000, 100,000, and 1,000,000. (D) The mean MCC of the “sample and select” predictions for SHAPE data by sampling structures in the order of 1000, 10,000, 100,000, and 1,000,000. The bars in each plot indicate the standard error of the mean MCC.
Figure 4.
Figure 4.
Implications of SeqFold-derived RNA accessibility on translation efficiency and transcription initiation. (A) RNA accessibility around the translation start site positively correlates with ribosome density, a proxy of translation efficiency (Ingolia et al. 2009). Shown are the P-values of the Spearman correlation between average accessibility in a 30-bp-wide window and the ribosome density. Also shown are the relationship of ribosome density with the raw PARS signal (Kertesz et al. 2010), RNA accessibility calculated directly from RNAfold without experimental information, and GC content of the sequences. (B) The average accessibility increases near the 5′ end of a transcript and positively correlates with Pol II density, a proxy of nascent transcription (Churchman and Weissman 2011). Shown are the average accessibilities in a 20-bp-wide window sliding from the TSS (blue) and the P-values of the Spearman correlation with the average Pol II density calculated from the [40, 100] region (red). (C) The 5′ end accessibility of a transcript positively correlates with histone modifiers and chromatin remodeling enzymes (Pokholok et al. 2005) but not nucleosome occupancy (Pokholok et al. 2005). Shown are the P-values of the Spearman correlations between the average accessibility in a 20-bp-wide window sliding downstream of TSS and various histone marks. (D) The 5′ end accessibility of a transcript negatively correlates with nucleosome occupancy at ∼50 bp downstream of TSS. Shown are the P-value of the anticorrelations between the average accessibility in a 20-bp-wide window sliding downstream of TSS and various histone marks. The data points are the centers of the windows.
Figure 5.
Figure 5.
Incorporation of RNA accessibility improves the identification of RBP targets. Shown are higher prediction accuracies for distinguishing true and false RBP targets than using motif count only evaluated on RIP-chip data sets of a number of RBPs with consensus motifs: (A) Msl5 with motif UACUAAC; (B) Puf3 with motif CNUGUAHAUA; (C) Puf3 with motif UGUAHAUA; (D) Puf4 with motif UGUAHMNUA; (E) Puf5 with motif WUUGUAWUWU; and (F) Yll032c with motif AAUACCY. The receiver operating characteristic (ROC) curves demonstrate the change of the true positive rate versus the false positive rate with varying cutoffs. The area under curve (AUC) of the ROC plot measures the discrimination accuracy. The higher the AUC, the better the discrimination accuracy is. The gray dashed line of the diagonal indicates no discrimination power (AUC=0.5).

References

    1. Alkemar G, Nygard O 2006. Probing the secondary structure of expansion segment ES6 in 18S ribosomal RNA. Biochemistry 45: 8067–8078 - PubMed
    1. Altschul SF, Gish W, Miller W, Myers EW, Lipman DJ 1990. Basic local alignment search tool. J Mol Biol 215: 403–410 - PubMed
    1. Aviran S, Trapnell C, Lucks JB, Mortimer SA, Luo S, Schroth GP, Doudna JA, Arkin AP, Pachter L 2011. Modeling and automation of sequencing-based characterization of RNA structure. Proc Natl Acad Sci 108: 11069. - PMC - PubMed
    1. Aviv T, Lin Z, Ben-Ari G, Smibert CA, Sicheri F 2006. Sequence-specific recognition of RNA hairpins by the SAM domain of Vts1p. Nat Struct Mol Biol 13: 168–176 - PubMed
    1. Baldi P, Brunak S, Chauvin Y, Andersen C, Nielsen H 2000. Assessing the accuracy of prediction algorithms for classification: An overview. Bioinformatics 16: 412–424 - PubMed

Publication types