

Tumour inflammasome-derived IL-1β recruits neutrophils and improves local recurrence-free survival in EBV-induced nasopharyngeal carcinoma
- PMID: 23065753
- PMCID: PMC3531603
- DOI: 10.1002/emmm.201201569
Tumour inflammasome-derived IL-1β recruits neutrophils and improves local recurrence-free survival in EBV-induced nasopharyngeal carcinoma
Abstract
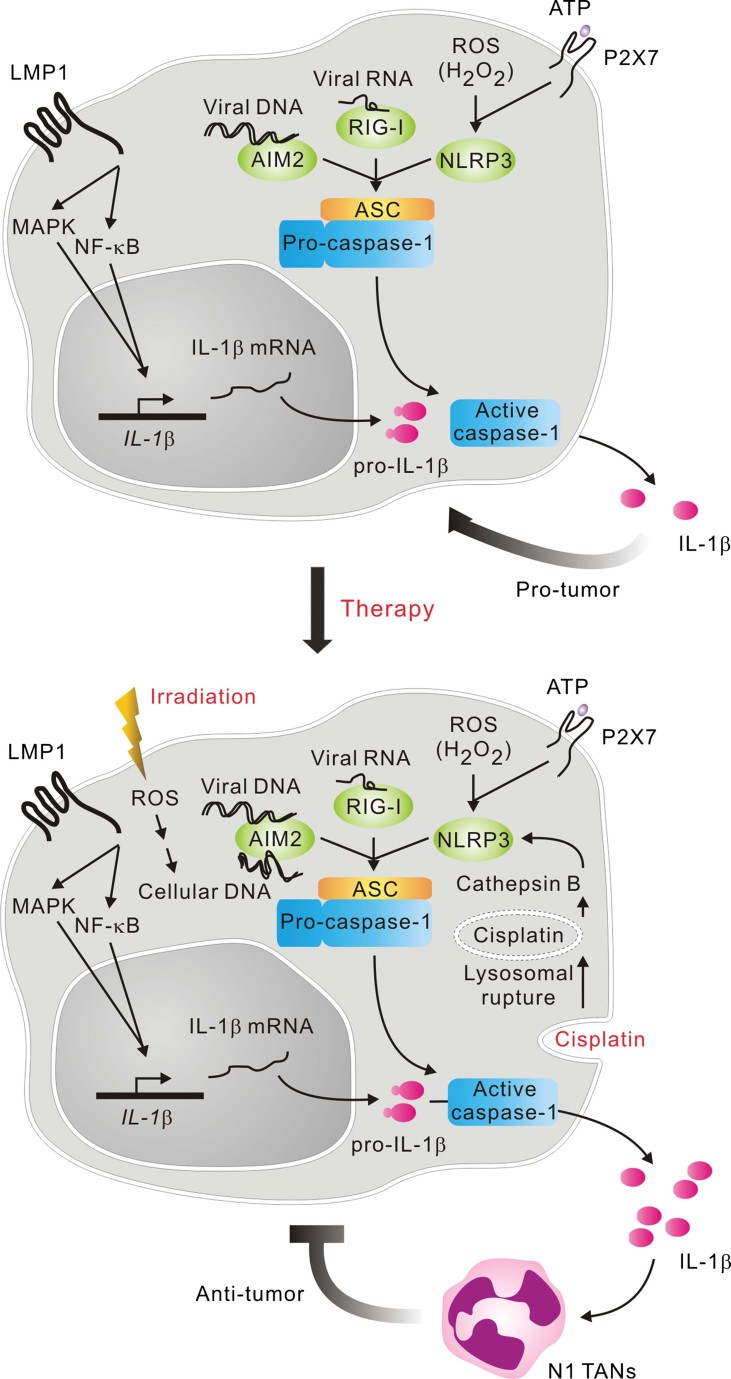
Inflammasomes sense infection and cellular damage and are critical for triggering inflammation through IL-1β production. In carcinogenesis, inflammasomes may have contradictory roles through facilitating antitumour immunity and inducing oncogenic factors. Their function in cancer remains poorly characterized. Here we show that the NLRP3, AIM2 and RIG-I inflammasomes are overexpressed in Epstein-Barr virus (EBV)-associated nasopharyngeal carcinoma (NPC), and expression levels correlate with patient survival. In tumour cells, AIM2 and RIG-I are required for IL-1β induction by EBV genomic DNA and EBV-encoded small RNAs, respectively, while NLRP3 responds to extracellular ATP and reactive oxygen species. Irradiation and chemotherapy can further activate AIM2 and NLRP3, respectively. In mice, tumour-derived IL-1β inhibits tumour growth and enhances survival through host responses. Mechanistically, IL-1β-mediated anti-tumour effects depend on infiltrated immunostimulatory neutrophils. We show further that presence of tumour-associated neutrophils is significantly associated with better survival in NPC patients. Thus, tumour inflammasomes play a key role in tumour control by recruiting neutrophils, and their expression levels are favourable prognostic markers and promising therapeutic targets in patients.
Copyright © 2012 The Authors. Published by John Wiley and Sons, Ltd on behalf of EMBO.
Figures
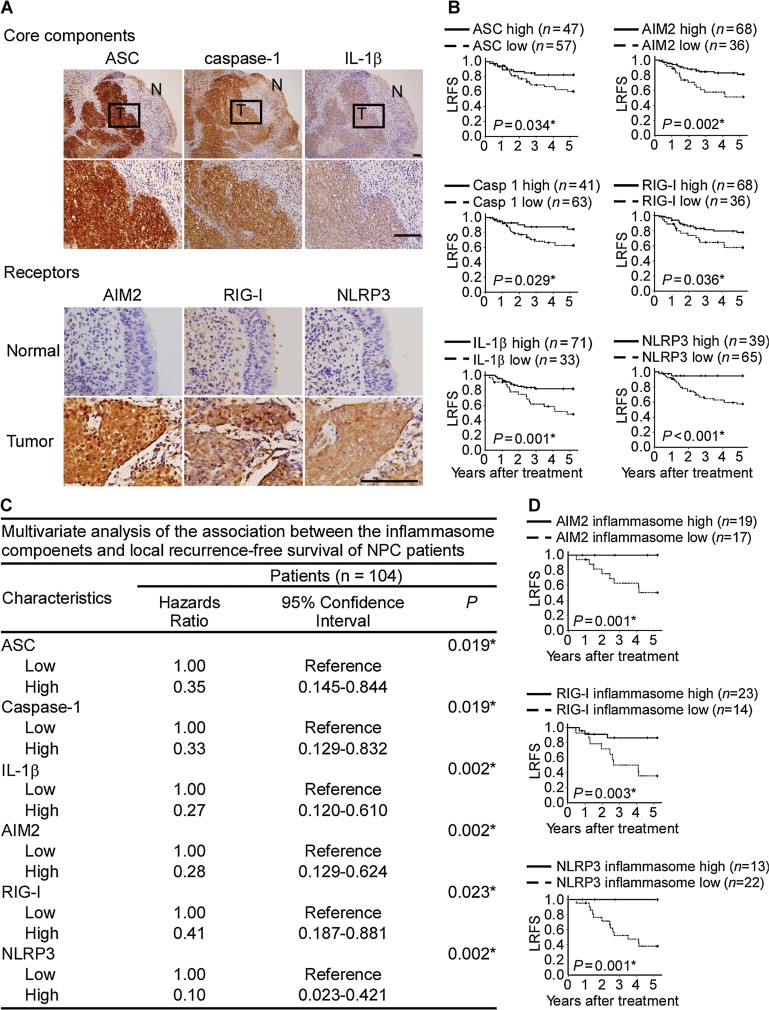
Overexpression of ASC, caspase-1 and IL-1β proteins as well as the inflammasome-receptor proteins in NPC tumour cells. Consecutive NPC tissue sections containing tumour (T) and adjacent non-tumour (N) cells were immunohistochemically stained with protein-specific antibodies. The results are shown at 100× magnification (upper panel), and the ‘N’ areas are shown at 400× magnification. The expression of these inflammasome receptors was relatively weak in the adjacent normal nasopharyngeal epithelial tissues. Bar, 100 µm.
Kaplan–Meier survival analysis of LRFS as a function of elevated inflammasome component expression in NPC patients.
Multivariant analysis of the association of inflammasome components with LRFS.
Kaplan–Meier survival analysis of LRFS as a function of each AIM2, RIG-I and NLRP3 inflammasome in NPC patients. AIM2 inflammasome high means the levels of all four AIM2 inflammasome components including AIM2, as well as three common components ASC, caspase-1 and IL-1β in NPC biopsy tissues are scored as high levels by immunohistochemistry analyses. Similarly, RIG-I inflammasome high or NLRP3 inflammasome high means high levels of RIG-I or NLRP3 combined with high levels of ASC, caspase-1 and IL-1β. *, statistically significant as indicated.
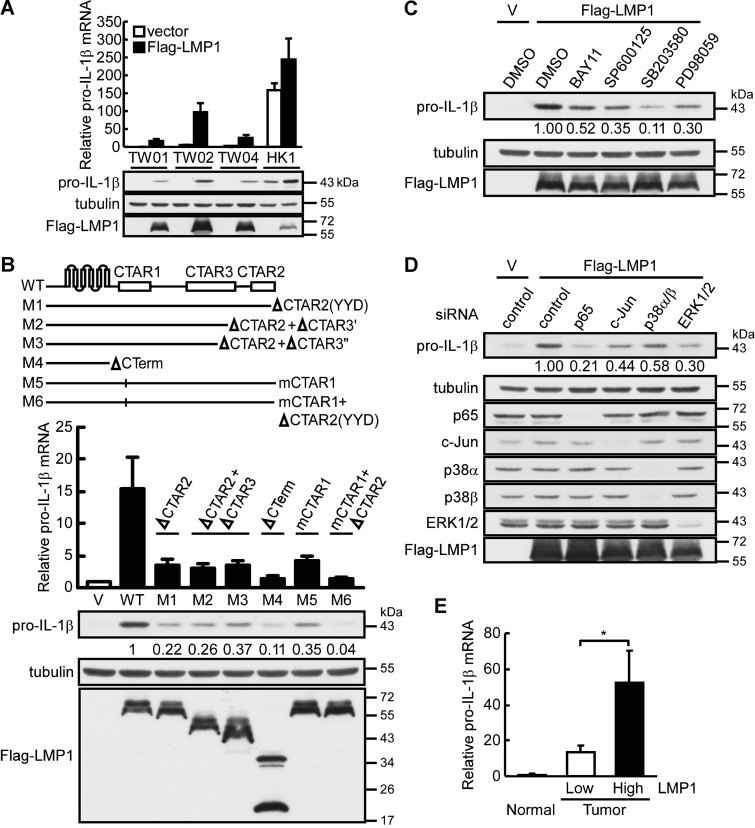
Induction of pro-IL-1β expression by LMP1 in NPC cell lines. NPC-TW01, -TW02, -TW04 and HK1 cells were transiently transfected with LMP1-expressing plasmid (Flag-LMP1), and pro-IL-1β mRNA and protein levels were determined at 24 h post-transfection by quantitative RT-PCR and Western blotting. All results are presented as the mean ± SD of three independent experiments.
Mapping the domain of LMP1 responsible for pro-IL-1β induction. LMP1 and its domain-specific mutants were transfected into NPC-TW02 cells, and pro-IL-1β mRNA and protein levels were determined at 24 h post-transfection by quantitative RT-PCR and Western blotting. All results are presented as the mean ± SD of three independent experiments.
The effect of inhibitors on pro-IL-1β induction. NPC-TW02 cells transfected with Flag-LMP1 expressing plasmid were treated with the specific inhibitors of NF-κB (BAY11-7082), JNK (SP600125), p38 MAPK (SB203580) and ERK1/2 (PD98059). The levels of pro-IL-1β protein were determined by Western blotting.
The effect of p65 NF-κB, c-Jun, p38α/β MAPK and ERK1/2 knockdown on pro-IL-1β induction. NPC-TW02 cells transfected with a siRNA targeting either p65 NF-κB, c-Jun, p38α/β MAPK or ERK1/2 were further transfected with an LMP1-expressing plasmid. The levels of pro-IL-1β protein were determined by Western blotting.
Correlation of LMP1 and pro-IL-1β mRNA expression in NPC biopsies. The relative fold change of LMP1 and pro-IL-1β mRNA expression between NPC and adjacent normal tissues was determined by quantitative RT-PCR. The 20 tumour tissues were divided into two groups by their relative expression levels of LMP1: high LMP1 (n = 10) and low LMP1 (n = 10). Normal tissues, n = 7. The results are presented as the mean ± SD and analysed by Student's t test. *p = 0.045.
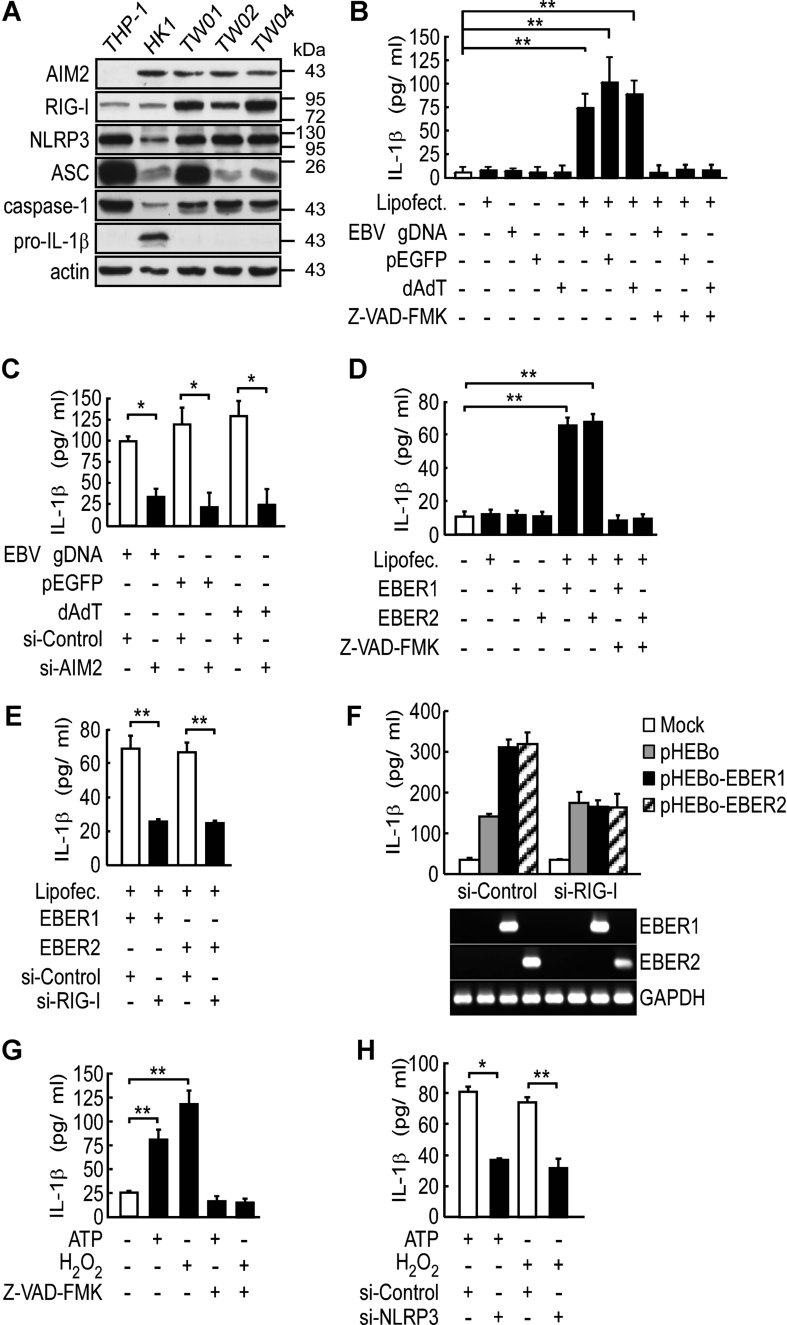
A. Expression of inflammasome components in NPC cell lines. The protein levels of individual components and actin (loading control) were determined by Western blotting of cell lysates. The THP-1 cells were used as a positive control.
B,C. IL-1β induction by EBV gDNA via AIM2. HK1 cells were transfected with fragmented EBV gDNA, pEGFP or poly (dA:dT) for 12 h, with or without a pretreatment with Z-VAD-FMK (10 µM) for 30 min (B), or pre-transfection with AIM2-targeting or control siRNA for 48 h (C). **p = 0.001, 0.004 and 0.002 for EBV gDNA, pEGFP and poly (dA:dT), respectively (B); *p = 0.006, 0.002 and 0.003 for EBV gDNA, pEGFP and poly (dA:dT), respectively (C). All results are presented as the mean ± SD of three independent experiments and analysed by Student's t test.
D,E. IL-1β induction by EBERs via RIG-I. HK1 cells were transfected with in vitro-transcribed EBER1 and EBER2 for 12 h, with or without a pretreatment with Z-VAD-FMK (D), or pre-transfection with RIG-I-targeting or control siRNA for 48 h (E). **p = 0.006 and 0.002 for EBER1 and EBER2, respectively (D); **p = 0.009 and 0.009 for EBER1 and EBER2, respectively (E). All results are presented as the mean ± SD of three independent experiments and analysed by Student's t test.
F. RIG-I activation by endogenous EBERs. HK1 cells were transfected with vector control (pHEBo), EBER1- or EBER2-expressing plasmid with pre-transfection with RIG-I-targeting or control siRNA for 48 h. Expression of EBERs was confirmed by RT-PCR. GAPDH was used as a positive control. The results are presented as the mean ± SD of three independent experiments.
G,H. IL-1β induction by ATP and H2O2 via NLRP3. HK1 cells were treated with ATP (5 mM) for 4 h or with H2O2 (10 µM) for 24 h, with or without a pretreatment with Z-VAD-FMK (G), or pre-transfection with NLRP3-targeting or control siRNA for 48 h (H). IL-1β production was used to measure inflammasome activity. **p = 0.0001 and 0.0004 for ATP and H2O2, respectively (G); *p = 0.022 and **p = 0.007 for ATP and H2O2, respectively (H). All results are presented as the mean ± SD of three independent experiments and analysed by Student's t test.
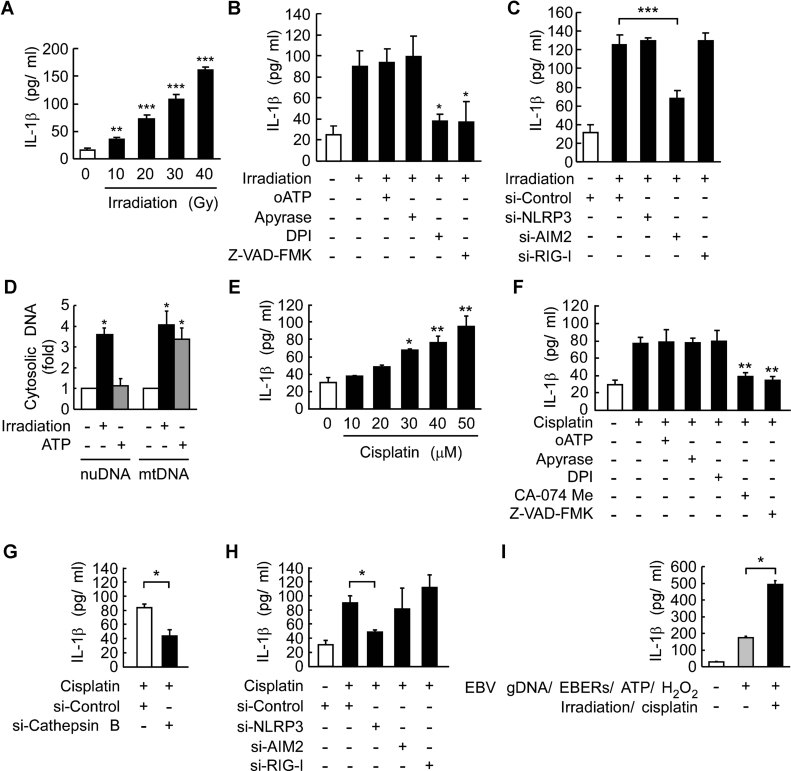
Dose-dependent induction of IL-1β by irradiation. HK1 cells were treated with various doses of irradiation for 24 h. **p = 0.001; ***p = 2.7E−05, 9.8E−06 and 9.7E−08 for 20, 30 and 40 Gy, respectively. All results are presented as the mean ± SD of six independent experiments and analysed by Student's t test.
ROS production is required for the induction of IL-1β by irradiation. HK-1 cells were irradiated (30 Gy) with or without a 30 min pretreatment with oATP (100 µM), apyrase (2.5 unit/ml), DPI (10 µM) or Z-VAD-FMK. *p = 0.02 and 0.035 for DPI and Z-VAD-FMK, respectively. All results are presented as the mean ± SD of three independent experiments and analysed by Student's t test.
Requirement of AIM2 for irradiation-induced IL-1β production. HK-1 cells transfected with NLRP3-targeting, AIM2-targeting, RIG-I-targeting, and control siRNA for 48 h were irradiated. ***p = 0.0003, all results are presented as the mean ± SD of three independent experiments and analysed by Student's t test.
Quantitative PCR analysis of cytosolic DNA in irradiation-treated HK1 cells. HK1 cells were treated with irradiation (30 Gy) for 24 h or ATP (5 mM) for 4 h. Nuclear DNA and mitochondrial DNA were indicated as nuDNA and mtDNA, respectively. *p = 0.005 (nuDNA analysis); *p = 0.016 and 0.017 for irradiation and ATP, respectively (mtDNA analysis). All results are presented as the mean ± SD of three independent experiments and analysed by Student's t test.
Dose-dependent induction of IL-1β by cisplatin. HK1 cells were treated with various doses of cisplatin for 24 h. *p = 0.012. **p = 0.007 and 0.003 for 40 and 50 µM, respectively. All results are presented as the mean ± SD of three independent experiments and analysed by Student's t test.
Requirement of cathepsin B activity for the induction of IL-1β by cisplatin. HK-1 cells were incubated with 40 µM cisplatin with or without a 30 min pretreatment with oATP, apyrase, DPI, CA-074 Me (10 µM) or Z-VAD-FMK. **p = 0.0017 and 0.0005 for CA-074 Me and Z-VAD-FMK, respectively. All results are presented as the mean ± SD of three independent experiments and analysed by Student's t test.
Requirement of cathepsin B for cisplatin-induced IL-1β production. HK-1 cells transfected with cathepsin B-targeting and control siRNA for 48 h were treated with cisplatin. *p = 0.037. The results are presented as the mean ± SD of three independent experiments and analysed by Student's t test.
Requirement of NLRP3 for cisplatin-induced IL-1β production. HK-1 cells transfected with NLRP3-targeting, AIM2-targeting, RIG-I-targeting and control siRNA for 48 h were treated with cisplatin. *p = 0.029. The results are presented as the mean ± SD of three independent experiments and analysed by Student's t test.
Enhanced induction of tumour microenvironmental factor-stimulated IL-1β by therapeutic treatments. HK1 cells were treated with tumour microenvironmental factors, EBV gDNA/EBERs/ATP/H2O2 as previously described with or without therapies, irradiation and cisplatin. IL-1β production was used to measure inflammasome activity. *p = 0.00004, the results are presented as the mean ± SD of four independent experiments and analysed by Student's t test.
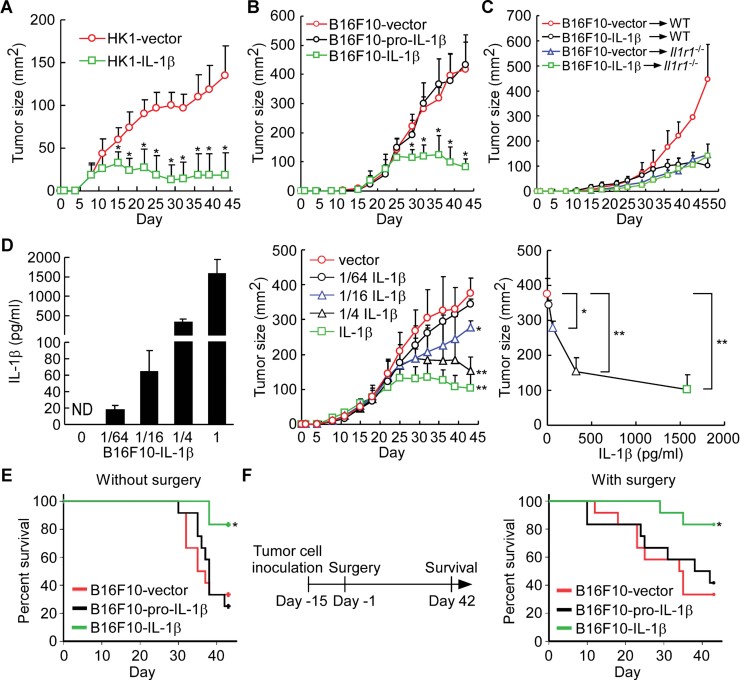
Tumour growth of IL-1β-expressing HK1 cells in a xenograft model. Nude mice were injected with HK1-vector or HK1-IL-1β cells (n = 9 per group). *p = 4.6E−04, 6.2E−06, 4.0E−06, 4.1E−07, 5.4E−09, 5.0E−08, 1.0E−06, 5.3E−07 and 4.3E−07 at day 15, 18, 22, 25, 29, 32, 36, 39 and 43 post-inoculation, respectively. All results are presented as the mean ± SD of three independent experiments and analysed by Student's t test.
Tumour growth of IL-1β- and pro-IL-1β-expressing B16F10 cells in a syngeneic mouse model. Wild-type mice were injected with B16F10-vector, B16F10-pro-IL-1β and B16F10-IL-1β cells (n = 12 per group). *p = 1.1E−06, 1.5E−06, 6.9E−03, 9.7E−04 and 5.7E−03 at day 29, 32, 36, 39 and 43 post-inoculation, respectively. All results are presented as the mean ± SD of three independent experiments and analysed by Student's t test.
Tumour growth of B16F10-vector and B16F10-IL-1β cells in wild-type and Il1r1−/− mice (n = 4–6 per group). All results are presented as the mean ± SD of three independent experiments.
Dose effect of IL-1β secretion on tumour growth inhibition. IL-1β in supernatants from B16F10-IL-1β cells premixed with B16F10-vector cells by indicated ratio (left panel). Tumour growth of B16F10-IL-1β mixed cells in a syngeneic mouse model (middle panel, n = 8 per group). Correlation between the tumour sizes at day 43 and IL-1β secretion of B16F10-IL-1β premixed cells (right panel). *p = 0.022 (1/16 IL-1β vs. vector); **p = 8.5E−04 (1/4 IL-1β vs. vector) and 1.2E−05 (IL-1β vs. vector). All results are presented as the mean ± SD of three independent experiments and analysed by Student's t test.
Survival rate in mice bearing IL-1β- and pro-IL-1β-expressing B16F10 cells. Syngeneic mice were injected with B16F10-vector, B16F10-pro-IL-1β or B16F10-IL-1β cells (n = 12 per group) and survival curves were plotted using the Kaplan–Meier method and compared using the log-rank test. *p = 0.009. The results were obtained from three independent experiments.
Survival rate in mice with surgical removal of primary tumours. B16F10-vector, B16F10-pro-IL-1β and B16F10-IL-1β tumours were established and then surgically removed after 14 days (n = 12 per group) and survival curves were plotted using the Kaplan–Meier method and compared using the log-rank test. *p = 0.036. The results were obtained from three independent experiments.
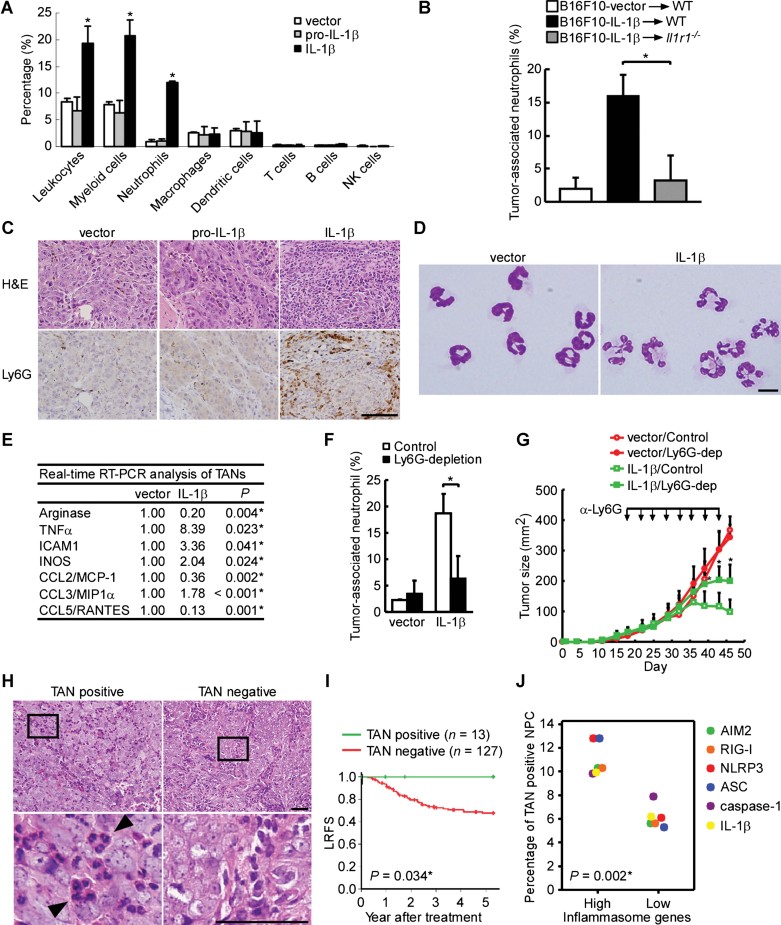
Leukocyte subsets in tumours. Percentage of leukocytes (CD45+), myeloid cells (CD11b+), neutrophils (CD11b+/Ly6G+), macrophages (CD11b+/F4/80+), dendritic cells (CD11c+), T cells (CD3+), B cells (B220+) and NK cells (NK1.1+) in the B16F10-IL-1β-, B16F10-pro-IL-1β- or B16F10-vector-bearing tumours (n = 3 per group) was determined by flow cytometry. *p = 0.0364, 0.0222 and 0.0004 for leukocytes, myeloid cells and neutrophils, respectively. The results are presented as the mean ± SD of three independent experiments and analysed by Student's t test.
Induction of intratumoural neutrophils by IL-1β. Percentage of TANs (CD11b+/Ly6G+) in the B16F10-IL-1β and B16F10-vector-bearing tumours (n = 3 per group) in wild-type and Il1r1−/− mice was determined by flow cytometry. *p = 0.003. The results are presented as the mean ± SD of three independent experiments and analysed by Student's t test.
Increased TANs in B16F10-IL-1β tumour. Ly6G immunohistochemistry performed on tumour tissues. Scale bars, 100 µm.
The morphology of TANs. Neutrophils were sorted from CD11b+/Ly6G+ cells in B16F10-vector or B16F10-IL-1β tumours. Scale bars, 10 µm.
Quantitative RT-PCR analysis. The fold change of gene expression in purified neutrophils (CD11b+/Ly6G+) of B16F10-IL-1β- and B16F10-vector-tumours, using the expression level in TANs from B16F10-vector-tumours as the denominator, was calculated (n = 3 per group). The results were obtained from three independent experiments and analysed by Student's t test.
Neutrophil depletion. Mice bearing B16F10-IL-1β- or B16F10-vector-tumours were injected with either the anti-Ly6G 1A8 or a control IgG antibody intraperitoneally twice a week (n = 4 per group). After 2 weeks, the percentages of TANs (CD11b+/Ly6G+) in whole tumour cells were determined by flow cytometry. *p = 0.005. The results are presented as the mean ± SD of four independent experiments and analysed by Student's t test.
Effect of neutrophil depletion on tumour growth. Mice bearing B16F10-IL-1β- or B16F10-vector-tumours were injected with antibodies described in (F) intraperitoneally (arrowheads) twice a week during the study period (n = 7–9 per group). *p = 0.006, 0.003 and 0.002 at day 39, 43 and 46 post-inoculation, respectively. All results are presented as the mean ± SD and analysed by Student's t test. Each experiment was repeated at least twice.
TANs in NPC tumours. The H&E results are shown at 400× magnification (upper panel) and the enlarged box areas (lower panel). Arrowhead indicates the TANs. Scale bars, 50 µm.
Kaplan–Meier survival analysis of LRFS.
Correlation of TANs and pro-IL-1β and inflammasome components in NPC biopsies. The positive rates of TANs in patients with high expression levels of AIM2, RIG-I, NLRP3, ASC, caspase-1 and IL-1β versus the positive rates of TANs in patients with low expression levels of the above-described proteins are analysed using Student's t test (Supporting Information Table S13).
References
-
- An X, Ding PR, Wang FH, Jiang WQ, Li YH. Elevated neutrophil to lymphocyte ratio predicts poor prognosis in nasopharyngeal carcinoma. Tumour Biol. 2011;32:317–324. - PubMed
-
- Apte RN, Voronov E. Is interleukin-1 a good or bad ‘guy’ in tumor immunobiology and immunotherapy. Immunol Rev. 2008;222:222–241. - PubMed
-
- Bernstein SH, Fay J, Frankel S, Christiansen N, Baer MR, Jacobs C, Blosch C, Hanna R, Herzig G. A phase I study of recombinant human soluble interleukin-1 receptor (rhu IL-1R) in patients with relapsed and refractory acute myeloid leukemia. Cancer Chemother Pharmacol. 1999;43:141–144. - PubMed
Publication types
MeSH terms
Substances
LinkOut - more resources
Full Text Sources
Other Literature Sources
