

Quantitative analysis of hyperpolarized 129Xe ventilation imaging in healthy volunteers and subjects with chronic obstructive pulmonary disease
- PMID: 23065808
- PMCID: PMC3624045
- DOI: 10.1002/nbm.2880
Quantitative analysis of hyperpolarized 129Xe ventilation imaging in healthy volunteers and subjects with chronic obstructive pulmonary disease
Abstract
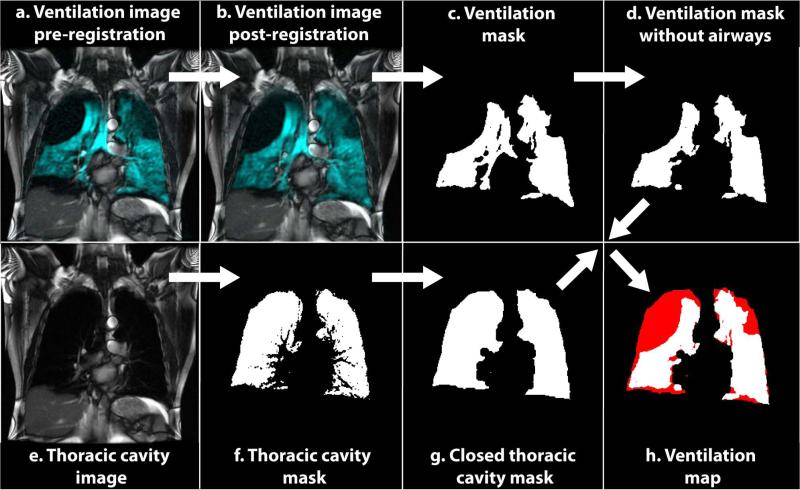
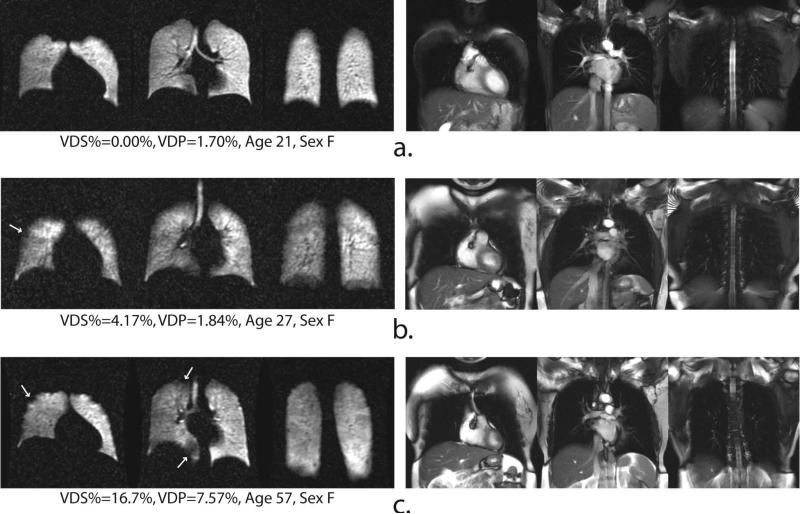
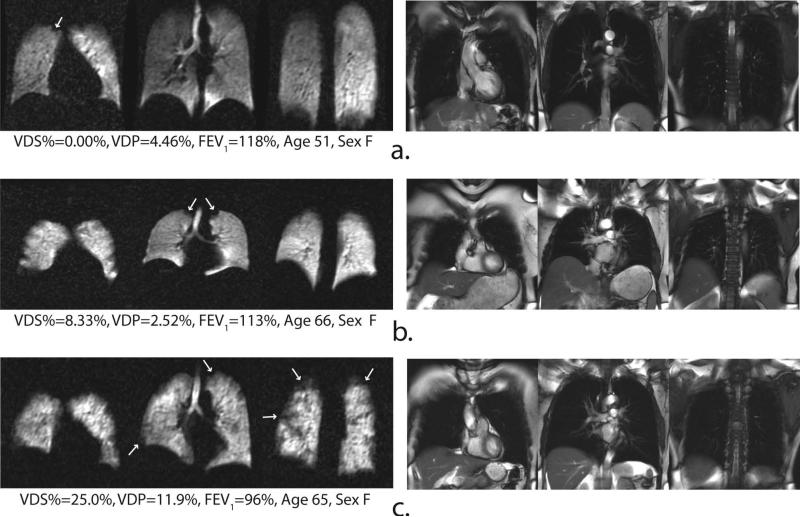
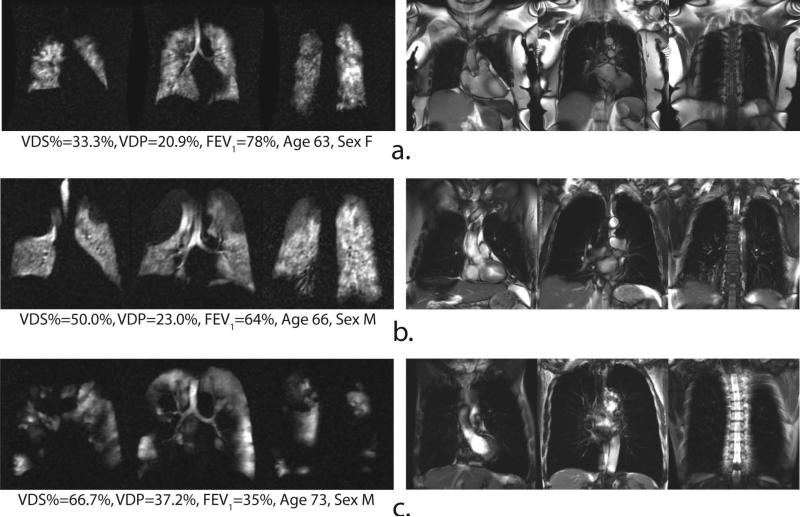
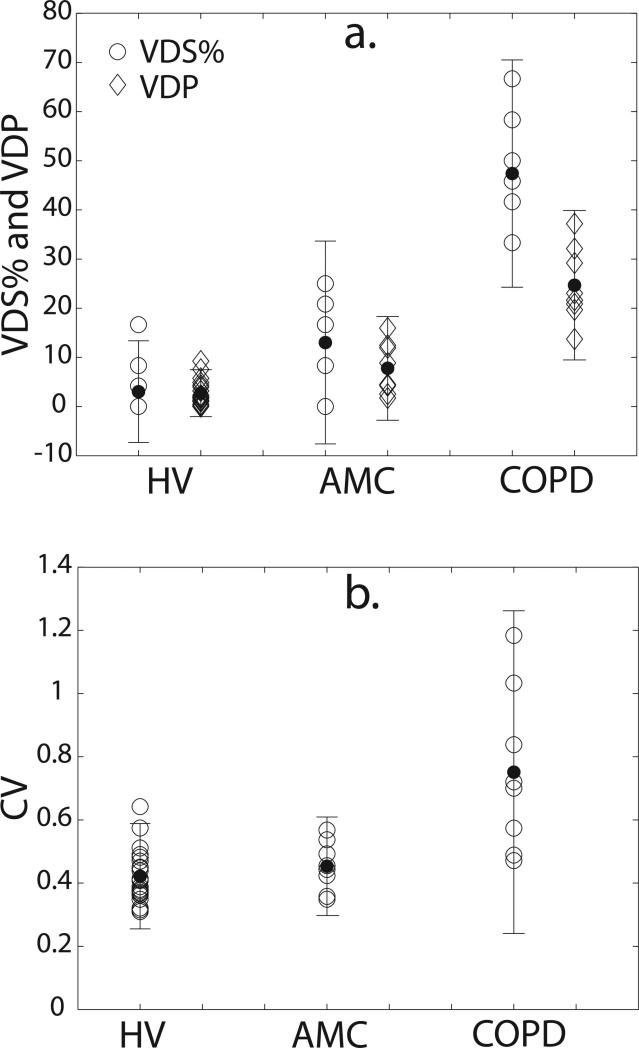
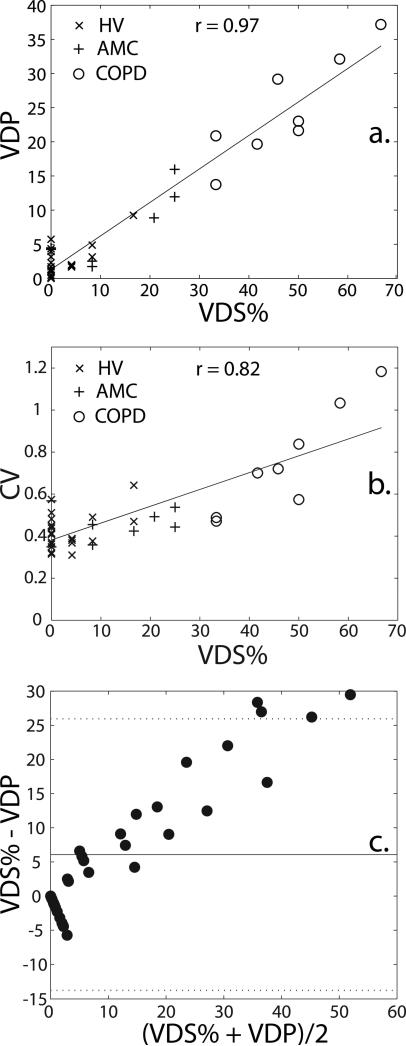
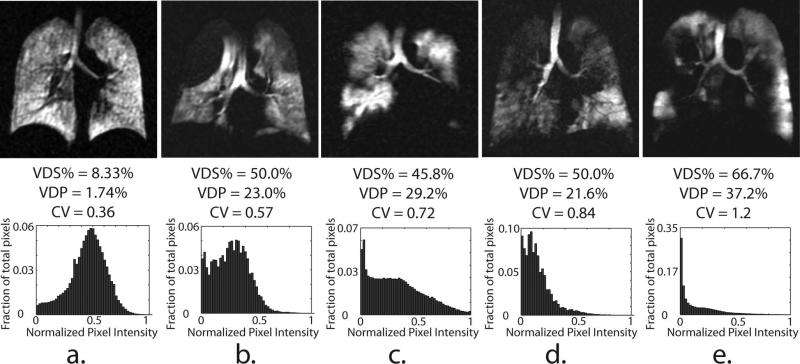
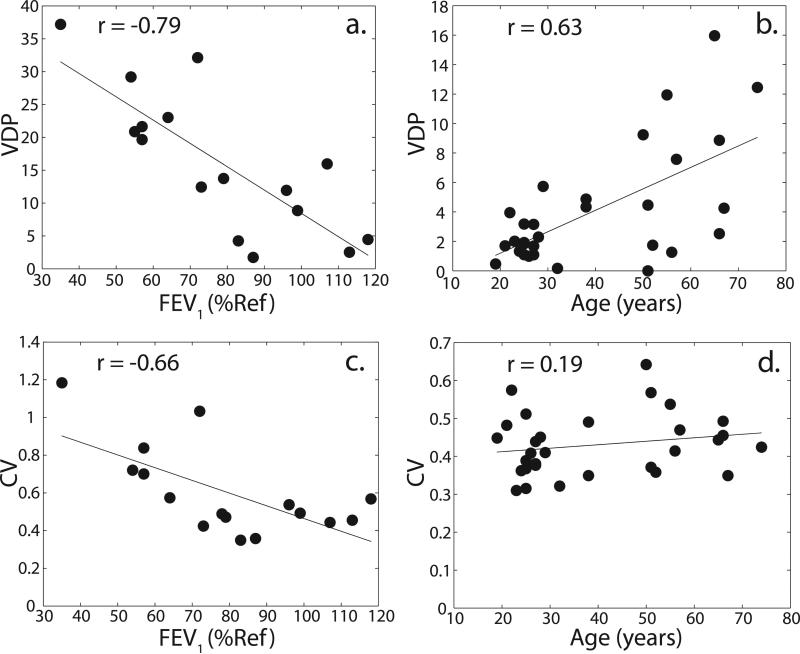
In this study, hyperpolarized (129) Xe MR ventilation and (1) H anatomical images were obtained from three subject groups: young healthy volunteers (HVs), subjects with chronic obstructive pulmonary disease (COPD) and age-matched controls (AMCs). Ventilation images were quantified by two methods: an expert reader-based ventilation defect score percentage (VDS%) and a semi-automated segmentation-based ventilation defect percentage (VDP). Reader-based values were assigned by two experienced radiologists and resolved by consensus. In the semi-automated analysis, (1) H anatomical images and (129) Xe ventilation images were both segmented following registration to obtain the thoracic cavity volume and ventilated volume, respectively, which were then expressed as a ratio to obtain the VDP. Ventilation images were also characterized by generating signal intensity histograms from voxels within the thoracic cavity volume, and heterogeneity was analyzed using the coefficient of variation (CV). The reader-based VDS% correlated strongly with the semi-automatically generated VDP (r = 0.97, p < 0.0001) and with CV (r = 0.82, p < 0.0001). Both (129) Xe ventilation defect scoring metrics readily separated the three groups from one another and correlated significantly with the forced expiratory volume in 1 s (FEV1 ) (VDS%: r = -0.78, p = 0.0002; VDP: r = -0.79, p = 0.0003; CV: r = -0.66, p = 0.0059) and other pulmonary function tests. In the healthy subject groups (HVs and AMCs), the prevalence of ventilation defects also increased with age (VDS%: r = 0.61, p = 0.0002; VDP: r = 0.63, p = 0.0002). Moreover, ventilation histograms and their associated CVs distinguished between subjects with COPD with similar ventilation defect scores, but visibly different ventilation patterns.
Keywords: 129Xe; COPD; MRI; coefficient of variation; defect; hyperpolarized; segmentation; ventilation.
Copyright © 2012 John Wiley & Sons, Ltd.
Figures
References
-
- Rabe KF, Hurd S, Anzueto A, Barnes PJ, Buist SA, Calverley P, Fukuchi Y, Jenkins C, Rodriguez-Roisin R, van Weel C, Zielinski J. Global strategy for the diagnosis, management, and prevention of chronic obstructive pulmonary disease - GOLD executive summary. American Journal of Respiratory and Critical Care Medicine. 2007;176(6):532–555. - PubMed
-
- Cazzola M, MacNee W, Martinez FJ, Rabe KF, Franciosi LG, Barnes PJ, Brusasco V, Burge PS, Calverley PMA, Celli BR, Jones PW, Mahler DA, Make B, Miravitiles M, Page CP, Palange P, Parr D, Pistolesi M, Rennard SI, Molken M, Stockley R, Sullivan SD, Wedzicha JA, Wouters EF. Outcomes for COPD pharmacological trials: from lung function to biomarkers. European Respiratory Journal. 2008;31(2):416–468. - PubMed
-
- Mahler DA, Mackowiak JI. Evaluation of the short-form 36-item questionnaire to measure health-related quality-of-life in patients with COPD. Chest. 1995;107(6):1585–1589. - PubMed
-
- Nishimura K, Izumi T, Tsukino M, Oga T, Japan KCRRG Dyspnea is a better predictor of 5-year survival than airway obstruction in patients with COPD. Chest. 2002;121(5):1434–1440. - PubMed
-
- Ashutosh K, Haldipur C, Boucher ML. Clinical and personality profiles and survival in patients with COPD. Chest. 1997;111(1):95–98. - PubMed
Publication types
MeSH terms
Substances
Grants and funding
LinkOut - more resources
Full Text Sources
Other Literature Sources
Medical
Miscellaneous
