. 2012 Dec 15;72(24):6362-70.
doi: 10.1158/0008-5472.CAN-12-2235. Epub 2012 Oct 12.

Evolutionary approaches to prolong progression-free survival in breast cancer

Affiliations

Evolutionary approaches to prolong progression-free survival in breast cancer

Ariosto S Silva et al. Cancer Res. .

Abstract

Many cancers adapt to chemotherapeutic agents by upregulating membrane efflux pumps that export drugs from the cytoplasm, but this response comes at an energetic cost. In breast cancer patients, expression of these pumps is low in tumors before therapy but increases after treatment. While the evolution of therapeutic resistance is virtually inevitable, proliferation of resistant clones is not, suggesting strategies of adaptive therapy. Chemoresistant cells must consume excess resources to maintain resistance mechanisms, so adaptive therapy strategies explicitly aim to maintain a stable population of therapy-sensitive cells to suppress growth of resistant phenotypes through intratumoral competition. We used computational models parameterized by in vitro experiments to illustrate the efficacy of such approaches. Here, we show that low doses of verapamil and 2-deoxyglucose, to accentuate the cost of resistance and to decrease energy production, respectively, could suppress the proliferation of drug-resistant clones in vivo. Compared with standard high-dose-density treatment, the novel treatment we developed achieved a 2-fold to 10-fold increase in time to progression in tumor models. Our findings challenge the existing flawed paradigm of maximum dose treatment, a strategy that inevitably produces drug resistance that can be avoided by the adaptive therapy strategies we describe.


Conflict of interest statement

Conflict of interest: The authors have no conflicts of interest to disclose.

Figures
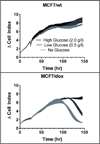
Figure 1
Figure 1. MCF-7 and MCF-7/Dox growth dependence on energy availability
The two breast cancer cell lines were plated at the same density in normal culture media (2g/L of glucose) and grown for 24h, when media was changed to normal glucose concentration (2g/L), low glucose concentration (0.5g/L), or no glucose. The PGP- cells maintain their growth in the three conditions, indicating that their energetic needs can be supplied from other sources in the media. The PGP mutant, however, shows loss of viability after 96h in glucose-free medium and 120h in low glucose serum.
Figure 2
Figure 2. Competition of MCF-7 wild type and PGP mutant cells in co-culture shows reversal of fitness by energy restriction and Verapamil
MCF-7 (wild type) and the PGP mutant (MCF-7/Dox ) were plated in a 2:1 ratio for 72h, when nuclei were counted, and wild type and PGP mutants were differentiated by calceinAM exclusion. In “high glucose” medium the PGP mutant showed a shorter doubling time than the wild type (22.4h versus 24h), and the addition of verapamil did not alter these values. In restricted glucose conditions, however, both populations replicated more slowly (28h and 26.3h for the wild type and PGP mutant, respectively). The addition of verapamil in low glucose conditions did not affected the growth of the wild type cells, but approximately doubled the doubling time of the PGP mutant (51h), indicating that the combination of energy restriction and a high-affinity PGP substrates tips the fitness advantage towards the wild type population. The bottom right charts depict the changes in doubling time of MCF-7 and MC-7/Dox, as a function of 2-deoxyglucose and verapamil. The wild type population (left) doubles at approximately every 24h in optimum conditions, but its growth is delayed upon reduction of 50% of glucose availability. The PGP mutant (right) has a faster doubling time than the wild type, and maintains its growth rate even at high rates of verapamil. However, energy restriction combined with the PGP substrate significantly delays replication. The equations that describe both curves are explained in the supplemental figure 1.
Figure 3
Figure 3. Differential glucose metabolism in MCF-7 and MCF-7/Dox
(Top left) 2-NBDG is a fluorescent glucose analog, which once internalized and phosphorylated, loses its fluorescence. The graph depicts, in arbitrary fluorescence units, the accumulation of non-phosphorylated 2-NBDG in the first hour of incubation. Using Michaelis-Menten dynamics, Vmax of glucose uptake for the PGP mutant is four times higher than for the wild type (165 RFU/min vs 40 RFU/min). (Bottom right) In glucose-free medium (“No Glu”), MCF-7 cells and PGP+ mutants (MCF-7/Dox) produce most of their energy through aerobic metabolism. Once glucose is added to the medium (Glu), MCF-7 and MCF-7/Dox cells increase their energy production through glycolysis by approximately 30% and 50%, respectively. The addition of oligomycin (Oli) greatly decreases aerobic metabolism in mitochondria, forcing cells to extract energy from anaerobic glycolysis exclusively, exposing the maximum glycolytic potential of these cells, which is roughly three times higher in the PGP+ mutant than in the parental cell line. The addition of the non-metabolizable glucose analog 2-deoxyglucose (2DG) greatly reduces energy production in both cell lines.
Figure 4
Figure 4. Tumor burden simulation of a hypothetical patient carrying a sub-population of 10% PGP mutants treated with standard or Adaptive Therapy regimens combined with verapamil and 2DG
Maximum tolerated dose (MTD, upper left) promptly reduces the total tumor burden, but the patient soon relapses and stops to respond. The combination of MTD with an anti-metabolite (2DG) and a PGP substrate (verapamil) increases patient survival in ~30% (upper right). Adaptive therapy (AT, bottom left) is capable of maintaining the resistant sub-population under control for longer (increase in overall survival by 50%). The best results are obtained when 2DG and verapamil are administered together with adaptive therapy resulting in a 4-fold increase in progression free survival (PFS). Progression-free survival was considered as the interval between the beginning of the treatment and the moment when the tumor burden resumes growth, in presence of therapy. In this example, PFS was 35 days for MTD and 135 days for AT + verapamil + 2DG. The simulations considered two sub-populations of cancer cells: the first corresponded to 90% of the tumor burden and had growth rate and drug response modeled from in vitro experiments with MCF-7 cells. The second sub-population represented 10% of the total tumor burden and had the same growth and drug response properties as the PGP mutant MCF-7/Dox. The description of the computational model and parameter values (doubling time and drug sensitivity) are described in the supplementary figure 1 and supplementary table 1. The IC50 for the chemosensitive sub-population was arbitrarily set to 1, while for the PGP+ mutant, it was considered to be 100-fold higher. The standard therapeutic dose was also set as one arbitrary unit, and the initial dose of the adaptive therapy algorithm was set as half this value.
Figure 5
Figure 5. Tumor burden simulation of a hypothetical patient carrying a sub-population of 5% PGP mutants treated with standard or Adaptive Therapy regimens combined with Verapamil and 2DG
In a hypothetical untreated patient with an average PGP+ sub-population (5%), the combination of adaptive therapy, 2DG and Verapamil (bottom right) is capable of maintaining the patient stable for over 500 days in contrast to the observed survival of 122 days of maximum tolerated dose (MTD, top left). Similarly to the Figure 4, these simulations consisted in a mix of chemosensitive and PGP-positive chemoresistant cells, but this time at a proportion of 95% and 5% of the total tumor burden, respectively. These two sub-populations were modeled based on in vitro data from the MCF-7 and MCF-7/Dox cell lines. The competition between these sub-clones was modeled as described in supplementary figure 1, with growth rate and dose response parameters listed supplementary table 1.

References

    1. Meads MB, Gatenby RA, Dalton WS. Environment-mediated drug resistance: a major contributor to minimal residual disease. Nat Rev Cancer. 2009;9:665–674. - PubMed
    1. Grogan TM, Spier CM, Salmon SE, Matzner M, Rybski J, Weinstein RS, et al. P-glycoprotein expression in human plasma cell myeloma: correlation with prior chemotherapy. Blood. 1993;81:490–495. - PubMed
    1. Sonneveld P, Schoester M, de Leeuw K. Clinical modulation of multidrug resistance in multiple myeloma: effect of cyclosporine on resistant tumor cells. J Clin Oncol. 1994;12:1584–1591. - PubMed
    1. Gutman D, Morales AA, Boise LH. Acquisition of a multidrug-resistant phenotype with a proteasome inhibitor in multiple myeloma. Leukemia. 2009;23:2181–2183. - PMC - PubMed
    1. Troutman MD, Thakker DR. Novel experimental parameters to quantify the modulation of absorptive and secretory transport of compounds by P-glycoprotein in cell culture models of intestinal epithelium. Pharm Res. 2003;20:1210–1224. - PubMed

Publication types

MeSH terms

Substances