. 2012 Dec;40(22):11477-89.
doi: 10.1093/nar/gks926. Epub 2012 Oct 11.

Telomere length homeostasis and telomere position effect on a linear human artificial chromosome are dictated by the genetic background

Affiliations

Telomere length homeostasis and telomere position effect on a linear human artificial chromosome are dictated by the genetic background

An Weuts et al. Nucleic Acids Res. 2012 Dec.

Abstract

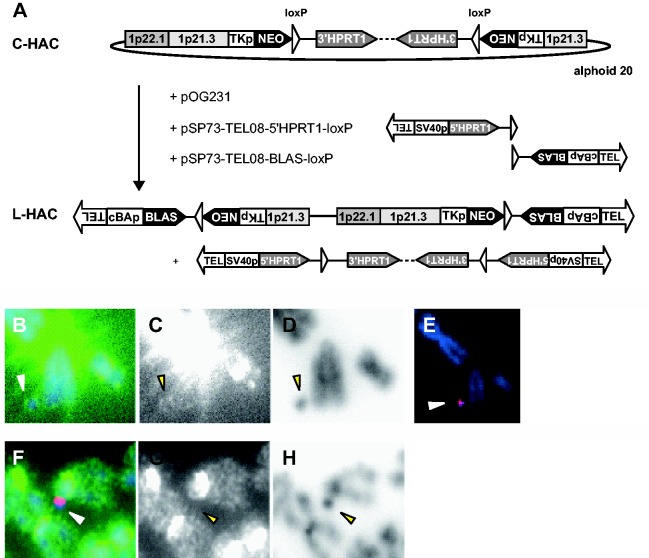
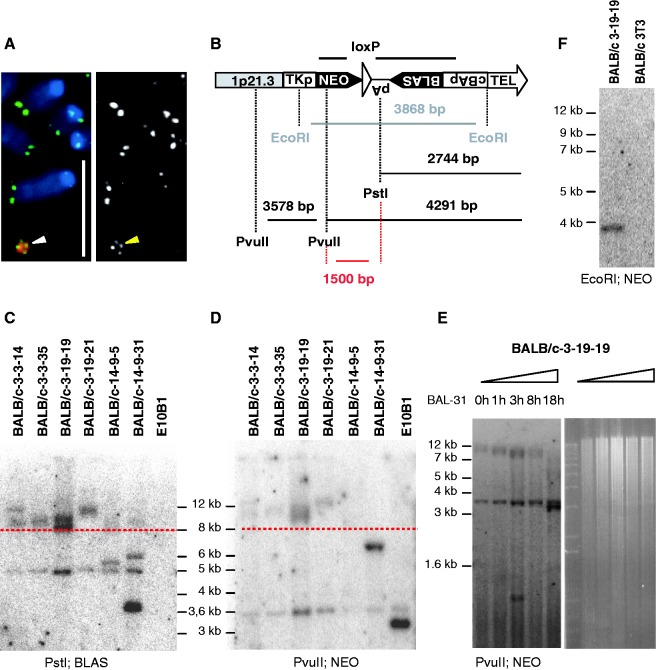
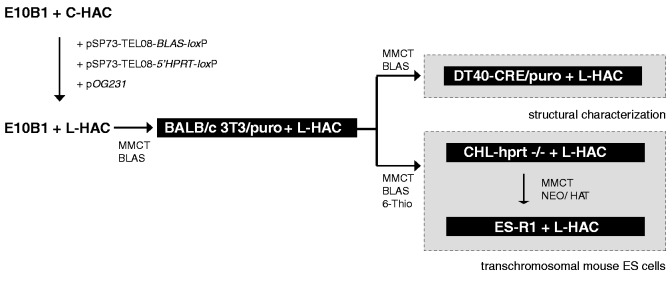
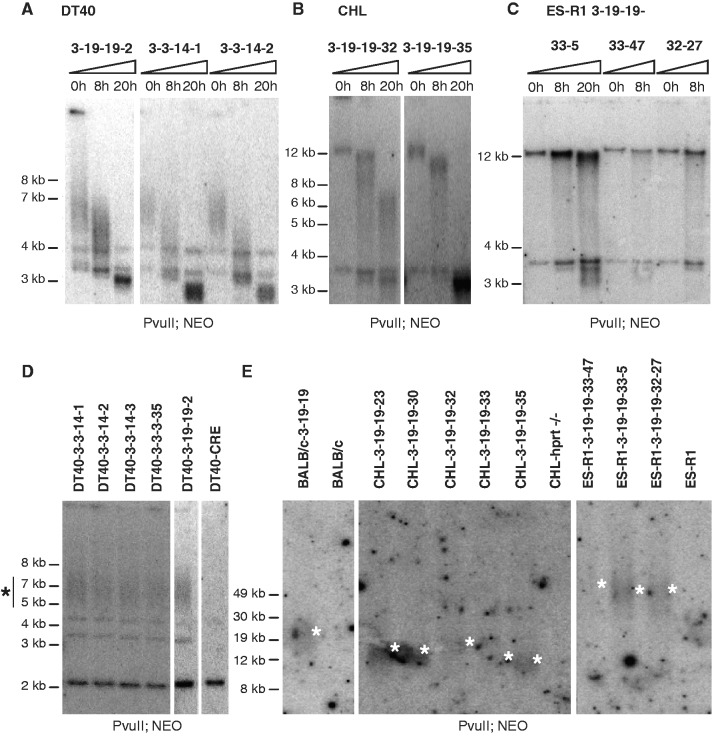
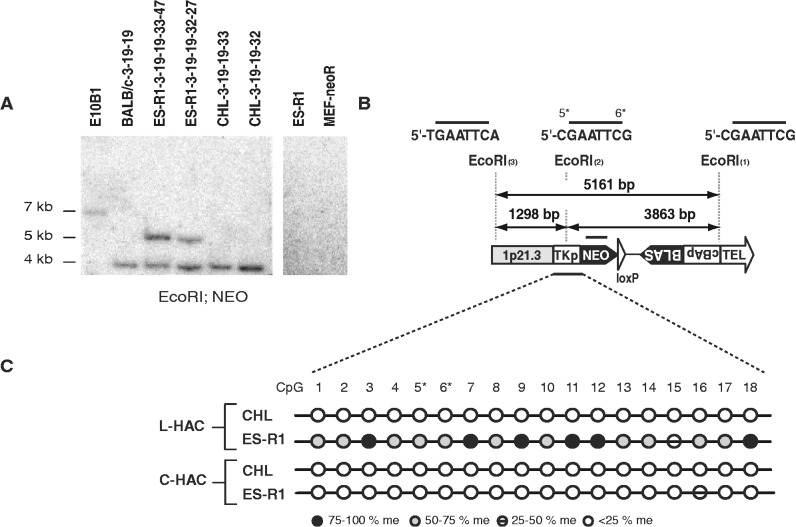
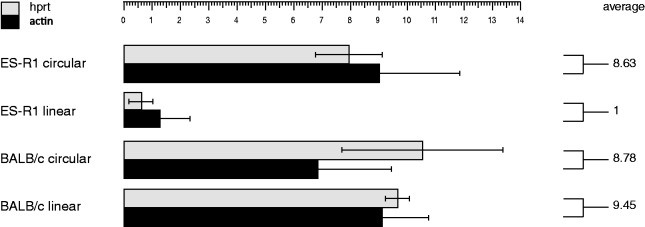
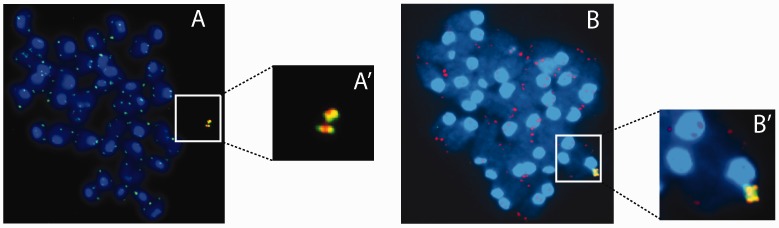
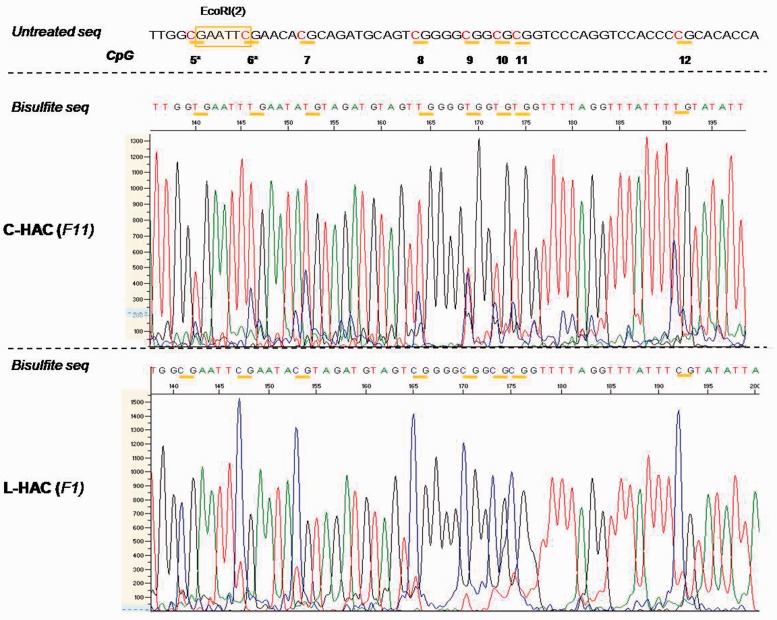
Telomere position effect (TPE) is the influence of telomeres on subtelomeric epigenetic marks and gene expression. Previous studies suggested that TPE depends on genetic background. As these analyses were performed on different chromosomes, cell types and species, it remains unclear whether TPE represents a chromosome-rather than genetic background-specific regulation. We describe the development of a Linear Human Artificial Chromosome (L-HAC) as a new tool for telomere studies. The L-HAC was generated through the Cre-loxP-mediated addition of telomere ends to an existing circular HAC (C-HAC). As it can be transferred to genetically distinct cell lines and animal models the L-HAC enables the study of TPE in an unprecedented manner. The HAC was relocated to four telomerase-positive cell lines via microcell-mediated chromosome transfer and subsequently to mice via blastocyst injection of L-HAC(+)-ES-cells. We could show consistent genetic background-dependent adaptation of telomere length and telomere-associated de novo subtelomeric DNA methylation in mouse ES-R1 cells as well as in mice. Expression of the subtelomeric neomycin gene was inversely correlated with telomere length and subtelomeric methylation. We thus provide a new tool for functional telomere studies and provide strong evidence that telomere length, subtelomeric chromatin marks and expression of subtelomeric genes are genetic background dependent.


Figures

Figure 1.
Figure 1.
Linearization of the C-HAC. (A) Plasmids pSP73-TEL08-5′HPRT1-loxP, pSP73-TEL08-BLAS-loxP and the CRE-expression plasmid pOG231 were co-transfected into the hprt/ E10B1 hamster cell line carrying the C-HAC. CRE/loxP-induced recombination resulted in a linearized HAC with a blasticidin selection marker and reconstituted the HPRT1 minigene, which was excised from the HAC. The orientation of the loxP sites in the constructs pSP73-TEL08-5′HPRT1-loxP and pSP73-TEL08-BLAS-loxP is designed in such a way that it does not allow any other recombination. (B–D) FISH analysis on E10B1 metaphase spreads with a PNA telomeric probe (green) counterstained with DAPI (blue). HACs displayed the expected four telomeric signals. Strong telomere signals were present on the hamster chromosomes due to the presence of interstitial telomeric repeats in the CHL cell line. (E) Rehybridization of the metaphases with an alphoid-20 DNA probe (red). (F–H) FISH with hamster Cot1 DNA (green) and alphoid-20 DNA probes (red). (C and G) Detailed image showing the PNA telomeric signal/hamster Cot1 signal in grayscale. (D and H) Corresponding color-inverted, grayscale DAPI images. Arrowheads point to the HACs.
Figure 2.
Figure 2.
Proof of HAC-linearization in mouse BALB/c 3T3 cells. (A) FISH with alphoid-20 DNA (red) and PNA telomeric (green) probes. Arrowheads point toward the HAC. Grayscale representation of the telomeric signal is shown on the right. Bar, 10 μm. (B) Schematic representation of TRF restriction digests and expected fragment lengths. Bold bars represent probes for neomycin (NEO) and blasticidin (BLAS). (C and D) Comparative TRF analyses of genomic DNA cut with PstI (C) or PvuII (D) that was size-separated by agarose gel electrophoresis and probed with the BLAS and NEO probes, respectively. Except for BALB/c 14-9-5 and 14-9-31 the BALB/c clones display an identical fragment pattern in the 8–12 kb region (above red-dashed line) for both restriction digests, with a 1.5 kb length difference. Internal control fragments of 5 kb (shown in C) and 3.6 kb (shown in D) were detected. (E) BAL-31 experiment on clone 3-19-19. Increasing the BAL-31 incubation-time preceding the TRF analysis resulted in decreasing fragment lengths. TRFs were monitored after 1, 3, 8 and 18 h of BAL-31 incubation. The 3.6 kb control fragment (D) remained unaltered. Right panel shows the EtBr-stained agarose gel. (F) Southern blot analysis (left panel) of EcoRI digested genomic DNA from clone BALB/c 3-19-19 probed with NEO resulted in the expected 3.9 kb fragment.
Figure 3.
Figure 3.
Overview of the transfer of the L-HAC to four different genetic backgrounds. The circular HAC originally resided in the E10B1 cells. Linearization was acquired via the co-transfection of two linear constructs pSP73-TEL08-BLAS-loxP and pSP73-TEL08-5′HPRT1-loxP with the CRE-expression plasmid pOG231. Putative L-HACs were transferred to a BALB/c 3T3/puro cell line by MMCT and subsequently to the DT40-CRE cell line, where they were structurally characterized (Supplementary Data). In addition they were relocated from the BALB/c cells to an hprt/ CHL cell line and next to the ES-R1 cell line. The latter was applied to generate transchromosomal mice. As such the linear HAC is present in four unique genetic backgrounds (gray rectangles) that can be used to study TPE and (sub-) telomeric alteration at a single telomeric end. Selection criteria are displayed.
Figure 4.
Figure 4.
TRF analyses of the L-HACs in the different genetic backgrounds. (A–C) Genomic DNA incubated with the BAL-31 exonuclease for 0, 8 or 20 h was digested with the PvuII restriction enzyme, blotted and probed for neomycin sequences. (A) The TRFs of the L-HAC present in the DT40 clones 3-19-19-2, 3-14-14-1 and 3-14-14-2 migrate between 5 kb and 8 kb (0 h). Increasing the BAL-31 incubation-time results in a decrease in TRF length. Typical BAL-31 degradation products are observed together with fragments inherent to the DT40 background. (B) A similar TRF pattern is observed upon BAL-31 incubation for CHL-clones 3-19-19-32 and 3-19-19-35. (C) Although in the ES-R1 background a decrease in TRF length is less pronounced, the typical degradation products for BAL-31 treatment are clearly present. (D–E) TRF analysis of genomic DNA, cut with PvuII and detected with the NEO probe. (D) TRF analysis of 5 DT40 clones (DT40-3-3-14-1, DT40-3-3-14-2, DT40-3-3-14-3, DT40-3-3-3-35, DT40-3-19-19-2) and the WT DT40-CRE line. TRFs consistently locate between 5 kb and 8 kb in all the tested clones. (E) PFGE of the TRFs of the linear HAC in the BALB/c, CHL and ES-R1 cells lines. TRFs for the BALB/c, CHL and ES-R1 cell lines were about 12.5–25 kb, 12–20 kb and 50 kb in size, respectively.
Figure 5.
Figure 5.
Analysis of the L-HAC subtelomeric region. (A) Southern blot analysis of genomic DNA derived from E10B1 cells with the C-HAC and BALBc, ES-R1 and CHL cells carrying the L-HAC, digested with EcoRI and probed for NEO. In addition to the 3.9 kb expected fragment an aberrant band of 5.1 kb was observed in clones ES-R1-3-19-19-32-27 and ES-R1-3-19-19-33-47. The 5.1 kb fragment was never detected in the wild-type ES-R1 cells or in the MEF-neoR cells. (B) Schematic overview of the subtelomeric region on the L-HAC. The latter encloses three EcoRI sites [(1), (2) and (3)] spaced 1298 bp [(2) and (3)] and 3863 bp [(1) and (2)] apart. EcoRI(2) is prone to CpG methylation, both at the C-nucleotide 5′ from its recognition site as on its terminal C-nucleotide (5* and 6*). EcoRI(3) contains no CpGs. Depending on the methylation status of EcoRI(2), Southern blot analysis with the NEO or BLAS probes will result in a fragment of either 3.9 kb (EcoRI(2) unmethylated) or 5.1 kb (EcoRI(2) methylated). The black bar above the NEO cassette represents the recognition site for the NEO probe. (C) Bisulfite treatment of an identical subtelomeric region from both the CHL and ES-R1 cells and for both the circular and the linear HAC. The selected region contains both the TK promotor and part of the Neomycin resistance gene and is represented by a black bar at the bottom of (B). The area contains 18 CpGs among which those of EcoRI(2) (5* and 6*). The methylation status of each of the CpGs is depicted by a colored circle according to the legend. Black circle: CpG methylated in >75% of the cells; dark gray circle: CpG is methylated in 50–75% of the cells; strikethrough circle: CpG methylated in 25–50% of the cells; white circle: CpG methylated in <25% of the cells.
Figure 6.
Figure 6.
Relative expression levels of the neomycin resistance gene from the circular and linear HAC in the BALB/c and ES-R1 cells. NEO expression levels are normalized to the expression of housekeeping genes Hprt and Actb and are calculated as the relative expression level per L-HAC. The average expression level per background is depicted. Data are presented such that the average expression level of the L-HAC in the ES-R1 cells is 1. SDs from three independent clones for each background are shown.
Figure 7.
Figure 7.
Telomere co-FISH on metaphase spreads derived from L-HAC+ ES-cells from clone 3-19-19-33-47 (A) and from mouse tail fibroblasts (F1-2 mice) (B). The HAC was identified via the alphoid-20 probe, labeled either in red (A) or green (B) whereas a telomeric probe, labeled in the complementary color, was used to screen for the presence of telomeric sequences. A′ and B′ display a magnification of the regions indicated in A and B, which display the complete metaphase. In panels A and A′ sister chromatids already separated whereas in panels B and B′ they are still connected.
Figure 8.
Figure 8.
In vivo bisulfite sequencing data for the C- and L-HAC. Analogous to the in vitro analysis, a region of 60 bp surrounding EcoRI(2) was analysed. All the CpGs are marked by horizontal yellow bars. They are termed 5–12 and correspond to CpGs 5–12 in Figure 5. All C nucleotides that precede a G nucleotide are highlighted in red. Genomic DNA of the mice containing the C-HAC was extracted from mouse tail fibroblast derived from mice backcrossed to the NMRI background for 11 generations. For the L-HAC, solely mice from generation 1 (F1) were available. The graphs represent screenshots from the chromatogram obtained from the 3130x Genetic Analyzer (Life Technologies). The scale on the left (0–1300 and 0–1500) reflects the peak intensity for each nucleotide readout. The CpG′s in the subtelomeric region of the L-HAC are clearly hypermethylated compared to their counterparts on the circular chromosome. Untreated seq: the untreated wild-type sequence at that specific locus; bisulfite seq: the sequence that was obtained upon bisulfite treatment and sequencing PCR; F11: the 11th generation of offspring; F1: the 1st generation of offspring.

Similar articles

Cited by

References

    1. Kazuki Y, Oshimura M. Human artificial chromosomes for gene delivery and the development of animal models. Mol. Ther. 2011;19:1591–1601. - PMC - PubMed
    1. Perez-Luz S, az-Nido J. Prospects for the use of artificial chromosomes and minichromosome-like episomes in gene therapy. J. Biomed. Biotechnol. 2010;2010:1–16. - PMC - PubMed
    1. Grimes BR, Monaco ZL. Artificial and engineered chromosomes: developments and prospects for gene therapy. Chromosoma. 2005;114:230–241. - PubMed
    1. Okamoto Y, Nakano M, Ohzeki J, Larionov V, Masumoto H. A minimal CENP-A core is required for nucleation and maintenance of a functional human centromere. EMBO J. 2007;26:1279–1291. - PMC - PubMed
    1. Lam AL, Boivin CD, Bonney CF, Rudd MK, Sullivan BA. Human centromeric chromatin is a dynamic chromosomal domain that can spread over noncentromeric DNA. Proc. Natl Acad. Sci. USA. 2006;103:4186–4191. - PMC - PubMed

Publication types