. 2012 Oct 15:1:e00013.
doi: 10.7554/eLife.00013.

A bacterial sulfonolipid triggers multicellular development in the closest living relatives of animals

Affiliations

A bacterial sulfonolipid triggers multicellular development in the closest living relatives of animals

Rosanna A Alegado et al. Elife. .

Abstract

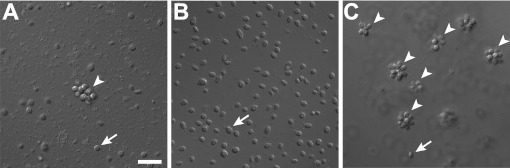
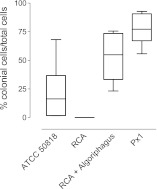
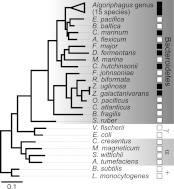
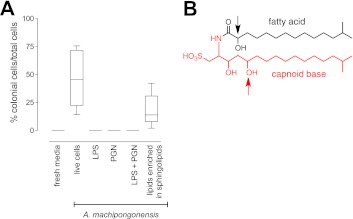
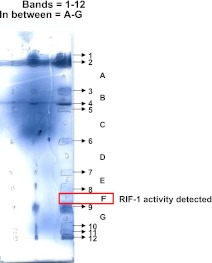
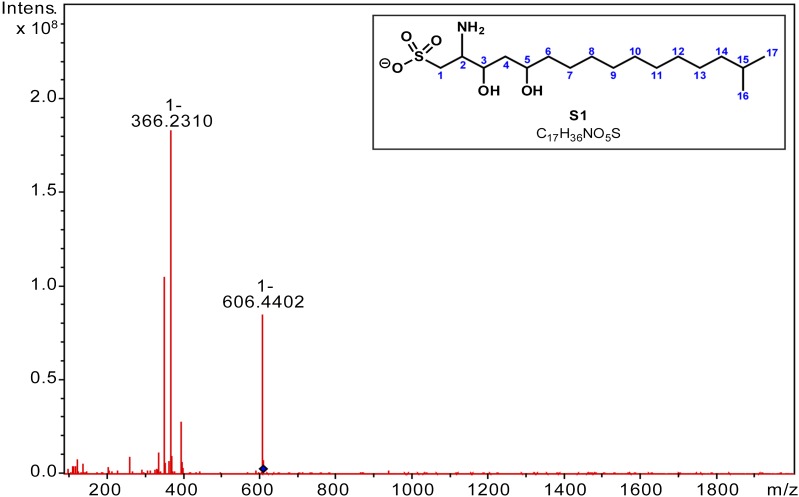
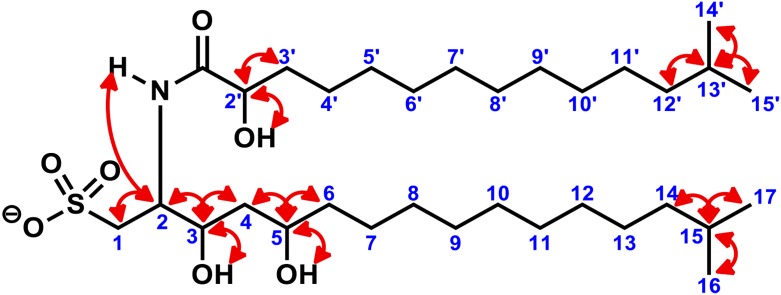
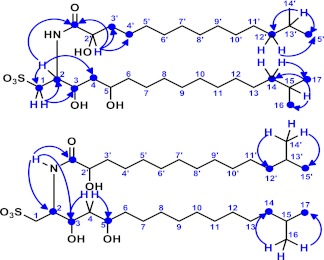
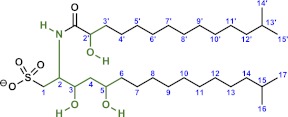
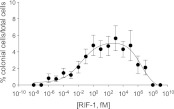
Bacterially-produced small molecules exert profound influences on animal health, morphogenesis, and evolution through poorly understood mechanisms. In one of the closest living relatives of animals, the choanoflagellate Salpingoeca rosetta, we find that rosette colony development is induced by the prey bacterium Algoriphagus machipongonensis and its close relatives in the Bacteroidetes phylum. Here we show that a rosette inducing factor (RIF-1) produced by A. machipongonensis belongs to the small class of sulfonolipids, obscure relatives of the better known sphingolipids that play important roles in signal transmission in plants, animals, and fungi. RIF-1 has extraordinary potency (femtomolar, or 10(-15) M) and S. rosetta can respond to it over a broad dynamic range-nine orders of magnitude. This study provides a prototypical example of bacterial sulfonolipids triggering eukaryotic morphogenesis and suggests molecular mechanisms through which bacteria may have contributed to the evolution of animals.DOI:http://dx.doi.org/10.7554/eLife.00013.001.

Keywords: Algoriphagus; Other; Salpingoeca rosetta; bacterial sulfonolipid; multicellular development.


Conflict of interest statement

JC: Reviewing Editor, eLife.

The remaining authors have no competing interests to declare.

Figures

Figure 1.
Figure 1.. Rosette colony development in S. rosetta is regulated by A. machipongonensis.
(A) The original culture of S. rosetta, ATCC 50818, contains diverse co-isolated environmental bacteria and forms rosette colonies (arrowheads) rarely. (B) Treatment of ATCC50818 with a cocktail of antibiotics reduced the bacterial diversity and yielded an S. rosetta culture line, RCA, in which rosette colonies never formed. (Representative single cells indicated by arrows.) (C) Addition of A. machipongonensis to RCA cultures was sufficient to induce rosette development. Scale bar, 2 μm. DOI: http://dx.doi.org/10.7554/eLife.00013.003
Figure 1—figure supplement 1.
Figure 1—figure supplement 1.. Frequency of rosette colonies in S. rosetta environmental isolate ATCC 50818, RCA with and without A. machipongonensis and a monoxenic line with A. machipongonensis feeder bacteria (Px1).
Altering bacterial diversity in S. rosetta cultures alters the frequency of rosette colonies. Data are the whisker-box plots of the frequency of colonial cells in ATCC 50818 and a monoxenic culture of S. rosetta fed only A. machipongonensis bacteria (Px1) for three experiments. DOI: http://dx.doi.org/10.7554/eLife.00013.004
Figure 2.
Figure 2.. Diverse members of the Bacteroidetes phylum induce rosette colony development.
A maximum likelihood phylogeny inferred from 16S rDNA gene sequences reveals the evolutionary relationships among A. machipongonensis, other members of the Bacteroidetes phylum, and representative γ-proteobacteria (γ), α-proteobacteria (α), and Gram-positive (+) bacteria. All 15 members of the Algoriphagus genus (Table 1), as well as six other species in the Bacteroidetes phylum, were competent to induce colony development (filled squares). In contrast, no species outside of Bacteroidetes and most of the non-Algoriphagus bacteria tested failed to induce rosette colony development (open squares). Scale bar, 0.1 substitutions per nucleotide position. DOI: http://dx.doi.org/10.7554/eLife.00013.006
Figure 3.
Figure 3.. RIF-1, a sulfonolipid that induces rosette colony development.
(A) Rosette colony development is induced by live A. machipongonensis and the sphingolipid-enriched lipid fraction (20 mg mL−1), but not by fresh medium, A. machipongonensis LPS (10 mg mL−1), PGN (50 mg mL−1), or LPS+PGN. Shown are the whisker-box plots of the % colonial cells/total cells under each condition in three independent experiments. (B) The molecular structure of RIF-1 deduced from MS and 1D- and 2D-NMR data. The RIF-1 structure, 3,5-dihydroxy-2-(2-hydroxy-13-methyltetradecanamido)-15-methylhexadecane-1-sulfonic acid, has two parts: a base (shown in red) that defines the capnine, and a fatty acid (shown in black). Features that distinguish RIF-1 from other known capnoids are shown with colored arrows: the 2-hydroxy on the fatty acid (black) and the 5-hydroxy on the capnine base (red). DOI: http://dx.doi.org/10.7554/eLife.00013.008
Figure 3—figure supplement 1.
Figure 3—figure supplement 1.. Separation of A. machipongonensis sphingolipids by thin layer chromatography (TLC).
Lipids enriched in sphingolipids were separated by TLC after visualization with ammonium molybdate in 10% H2SO4. Bands (1-12) as well as regions between bands (A-F) were tested for morphogenic activity. Region F possessed activity and was further purified. DOI: http://dx.doi.org/10.7554/eLife.00013.009
Figure 3—figure supplement 2.
Figure 3—figure supplement 2.. MS/MS analysis of RIF-1.
A major fragment derived from m/z = 606 (M-H) in the MS/MS spectrum of RIF-1 corresponds to amino-sulfonic acid S1. HRMS m/z calcd for C17H36NO5S (M-H): 366.23142. Found: 366.2310 (M-H)-. DOI: http://dx.doi.org/10.7554/eLife.00013.010
Figure 3—figure supplement 3.
Figure 3—figure supplement 3.. Key two-dimensional (2D) correlations of RIF-1: Observed COSY correlations.
Red double-head arrows show key 3J or 4J H-H correlations in the head regions (1 to 6 and 2′ to 3′) of the fatty acid and the capnine base and in the tail regions with geminal dimethyl groups (14 to 17 and 12′ to 15′). DOI: http://dx.doi.org/10.7554/eLife.00013.011
Figure 3—figure supplement 4.
Figure 3—figure supplement 4.. Key two-dimensional (2D) correlations of RIF-1: Observed HMBC spin system.
Blue single-head arrows show key 2J or 3J H-C correlations in the head and tail regions of the fatty acid and capnine base. The correlations between C-1′ and H-2/N-H demonstrated that the fatty acid and capnine base are joined through an amide bond. DOI: http://dx.doi.org/10.7554/eLife.00013.012
Figure 3—figure supplement 5.
Figure 3—figure supplement 5.. Key two-dimensional (2D) correlations of RIF-1: Observed TOCSY spin system.
Green bonds show two key spin systems in RIF-1 - HO-CH- in the fatty acid fragment and -CH2-CH(NH)-CH(OH)-CH2-CH(OH)-CH2- in the capnine base fragment. DOI: http://dx.doi.org/10.7554/eLife.00013.013
Figure 3—figure supplement 6.
Figure 3—figure supplement 6.. 1H NMR spectrum of RIF-1.
The spectrum exhibits one NH (δH 8.21), three hydroxyl groups (δH 5.52, 5.20, and 4.31), five signals from 2.50-4.00 ppm (four methines connected to either nitrogen at δH-2 3.88 or oxygens at δH-2′ 3.80/δH-3 3.71-3.78/δH-5 3.53-3.61, and one methylene connected to sulfur at δH-1 2.56 & 3.01), twenty methylenes and four methyls (δH d, J = 6.6 Hz, 12H) in the high field region (δH 0.75-1.75 ppm). DOI: http://dx.doi.org/10.7554/eLife.00013.014
Figure 3—figure supplement 7.
Figure 3—figure supplement 7.. gHMQC spectrum of RIF-1.
The 1J H-C correlations demonstrate that 2 (δH 3.88, δC 50.89) is connected to a nitrogen; 2′, 3, and 5 (δH 3.80/δC 71.29, δH 3.71-3.78/δC 71.51, and δH 3.53-3.61/δC 70.20, respectively) are oxygenated; 1 (δH 3.01 and 2.56, δC 51.87) is adjacent to a sulfonic acid group; and all the other twenty methylenes and four methyls at high filed (δH 0.75-1.75/δC 22.00-42.00). DOI: http://dx.doi.org/10.7554/eLife.00013.015
Figure 3—figure supplement 8.
Figure 3—figure supplement 8.. gCOSY spectrum of RIF-1.
Indicated are important H-H correlations between NH and H-2, 2′-OH and H-2′, 3-OH and H-3, and 5-OH and H-5. DOI: http://dx.doi.org/10.7554/eLife.00013.016
Figure 3—figure supplement 9.
Figure 3—figure supplement 9.. Expanded dqfCOSY spectrum of RIF-1.
In panel A (δH 1.15-1.65 ppm/δH 3.52-3.82 ppm), H-3 (δH 3.73) shows correlation to H-4a (δH 1.30), H-5 (δH 3.57) to H-4a/H-4b (δH 1.30/1.47), and H-5 to H2-6 (δH 1.20/1.29); H-2′ (∼δH 3.8) correlates to H2-3′ (δH 1.45 and 1.54). Panel B (δH 2.4-4.0 ppm/δH 2.4-4.0 ppm) demonstrates the correlations between H2-1 (δH 2.56/∼3.0) and H-2 (δH 3.88), and between H-2 and H-3. Panel C (δH 0.75-1.60 ppm/δH 0.75-1.60 ppm) exhibits correlations in the other methylenes and methyl groups. DOI: http://dx.doi.org/10.7554/eLife.00013.017
Figure 3—figure supplement 10.
Figure 3—figure supplement 10.. Expanded dqfCOSY spectra of RIF-1.
A dqfCOSY spectrum was collected in order to get a clear connectivity in the oxygenated region (1-position to 6-position) in the capnoid base fragment. DOI: http://dx.doi.org/10.7554/eLife.00013.018
Figure 3—figure supplement 11.
Figure 3—figure supplement 11.. gHMBC spectrum of RIF-1.
Indicated are important 2J or 3J H-C correlations between NH/H-2/H-2′ and C-1′ (δC 173.23), and between NH and C-2/C-3 (δC 50.89/71.51). Based on the MS/MS analysis, the fatty acid fragment must be 2-hydroxy-13-methyltetradecanoyl, and the capnine base fragment must be 2-NH-3,5-dihydroxy-15-methylhexadecane-1-sulfonate. Hence, the planar structure of RIF-1 is determined as shown in Fig. 3 and Fig. 3 – Figure Supplements 3-5. DOI: http://dx.doi.org/10.7554/eLife.00013.019
Figure 3—figure supplement 12.
Figure 3—figure supplement 12.. Expanded gHMBC spectrum of RIF-1 (δH 0-4.00 ppm/δC 15.0-85.0 ppm).
Indicated are correlations between H-2 to C-4/C-1 (δC 41.36/51.87), between H-2′ and C-4′/C-3′ (δC 24.99/34.85), between H-1 and C-2/C-3 (δC 50.89/71.51), and between H-4 and C-5/C-3 (δC 70.20/71.51). DOI: http://dx.doi.org/10.7554/eLife.00013.020
Figure 3—figure supplement 13.
Figure 3—figure supplement 13.. Expanded gHMBC spectrum of RIF-1 (δH 0.80-1.80 ppm/δC 20.0-40.0 ppm).
Key correlations are between H-16 and C-14/C-15/C-17 (δC 38.91/27.79/22.09), between H-17 and C-14/C-15/C-16 (δC 38.91/27.79/22.09), between H-14′ and C-12′/C-13′/C-15′ (δC 38.91/27.79/22.09), and between H-15′ and C-12′/C-13′/C-14′ (δC 38.91/27.79/22.09). DOI: http://dx.doi.org/10.7554/eLife.00013.021
Figure 3—figure supplement 14.
Figure 3—figure supplement 14.. TOCSY spectrum of RIF-1.
The spectrum shows correlations from NH to H2-1 and H-5 through H-2, H-3 and H2-4, and from 3-OH to H-5 via H2-4 and H2-1 through H-3 and H-2. DOI: http://dx.doi.org/10.7554/eLife.00013.022
Figure 3—figure supplement 15.
Figure 3—figure supplement 15.. Expanded TOCSY spectrum of RIF-1 (δH 0.50-4.25 ppm/δC 0.50-4.25 ppm).
Another important spin system is clearly demonstrated by the TOCSY correlations between H-2′ and H2-3′/H-4′/H-5′ on the top left of the expanded spectrum. DOI: http://dx.doi.org/10.7554/eLife.00013.023
Figure 4.
Figure 4.. Purified RIF-1 is active at plausible environmental concentrations.
RIF-1 concentrations ranging from 10−2 to 107 fM induce rosette colony development in RCA cultures. Frequency of rosette colony development was quantified in RCA cultures 2 days after treatment with a dilution series of purified RIF-1. Data are mean ± s.e. from three independent experiments. Line indicates non-linear regression of the RIF-1 activity profile. DOI: http://dx.doi.org/10.7554/eLife.00013.025
Figure 4—figure supplement 1.
Figure 4—figure supplement 1.. Detection of purified RIF-1.
RIF-1 did not show absorbance at 210 nm (top panel), but the molecule (606 Da, M-H) was detected between 25 and 26 minutes (bottom panel). DOI: http://dx.doi.org/10.7554/eLife.00013.026
Figure 4—figure supplement 2.
Figure 4—figure supplement 2.. Detection of RIF-1 in the conditioned medium of A. machipongonensis.
RIF-1 (bottom panel) was detected in the conditioned medium after the broth was concentrated 250 times. DOI: http://dx.doi.org/10.7554/eLife.00013.027
Figure 4—figure supplement 3.
Figure 4—figure supplement 3.. Co-injection of concentrated conditioned medium with purified RIF-1.
The peak of the RIF-1 in the conditioned medium was enhanced after the sample was spiked with purified RIF-1 (bottom panel). DOI: http://dx.doi.org/10.7554/eLife.00013.028

Comment in

  • doi: 10.7554/eLife.00242

Similar articles

Cited by

References

    1. Agosta WC. 1992. Chemical communication. Scientific American Press, New York
    1. Ahmed I, Yokota A, Fujiwara T. 2007. Chimaereicella boritolerans sp nov., a boron-tolerant and alkaliphilic bacterium of the family Flavobacteriaceae isolated from soil. Int J Syst Evol Microbiol 57: 986–992 - PubMed
    1. Alegado RA, Grabenstatter JD, Zuzow R, Morris A, Huang SY, Summons RE, King N. 2012. Algoriphagus machipongonensis sp. nov. co-isolated with a colonial choanoflagellate. Int J Syst Evol Microbiol [epub ahead of print] - PMC - PubMed
    1. An D, Na C, Bielawski J, Hannun YA, Kasper DL. 2011. Membrane sphingolipids as essential molecular signals for Bacteroides survival in the intestine. Proc Natl Acad Sci U S A 108 Suppl 1: 4666–4671 - PMC - PubMed
    1. Anton J, Oren A, Benlloch S, Rodriguez-Valera F, Amann R, Rossello-Mora R. 2002. Salinibacter ruber gen. nov., sp nov., a novel, extremely halophilic member of the bacteria from saltern crystallizer ponds. Int J Syst Evol Microbiol 52: 485–491 - PubMed

Publication types