. 2013 Jun;39(3):824-835.
doi: 10.1037/a0030094. Epub 2012 Oct 15.

Selection and storage of perceptual groups is constrained by a discrete resource in working memory

Affiliations

Selection and storage of perceptual groups is constrained by a discrete resource in working memory

David E Anderson et al. J Exp Psychol Hum Percept Perform. 2013 Jun.

Retraction in

  • Retraction of Anderson et al. (2013).
    [No authors listed] [No authors listed] J Exp Psychol Hum Percept Perform. 2015 Oct;41(5):1189. doi: 10.1037/xhp0000136. Epub 2015 Aug 17. J Exp Psychol Hum Percept Perform. 2015. PMID: 26280271 Free PMC article.

Abstract

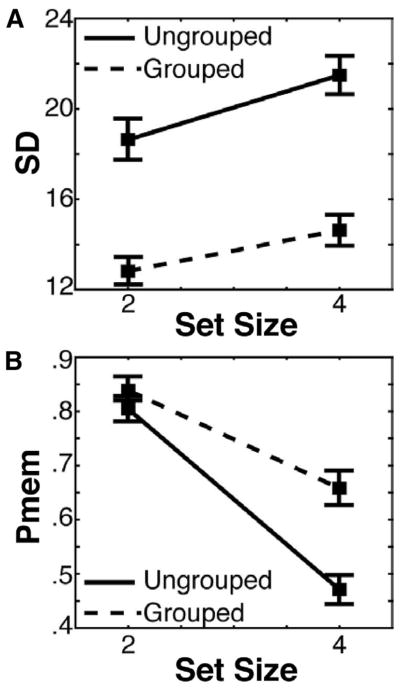
Perceptual grouping can lead observers to perceive a multielement scene as a smaller number of hierarchical units. Past work has shown that grouping enables more elements to be stored in visual working memory (WM). Although this may appear to contradict so-called discrete resource models that argue for fixed item limits in WM storage, it is also possible that grouping reduces the effective number of "items" in the display. To test this hypothesis, we examined how mnemonic resolution declined as the number of items to be stored increased. Discrete resource models predict that precision will reach a stable plateau at relatively early set sizes, because no further items can be stored once putative item limits are exceeded. Thus, we examined whether the precision by set size function was bilinear when storage was enhanced via perceptual grouping. In line with the hypothesis that each perceptual group counted as a single "item," precision still reached a clear plateau at a set size determined by the number of stored groups. Moreover, the maximum number of elements stored was doubled, and electrophysiological measures showed that selection and storage-related neural responses were the same for a single element and a multielement perceptual group. Thus, perceptual grouping allows more elements to be held in working memory while storage is still constrained by a discrete item limit.


Figures

Figure 1
Figure 1
Working memory task. Participants maintained fixation and were instructed to remember the orientation of all objects presented on the display. Set sizes used were 2, 4, 6, and 8. After a short delay period, participants were presented with a probe ring that determined which item was to be recalled. Participants used a mouse to indicate the orientation of the probed item.
Figure 2
Figure 2
Testing models that assume the storage of image elements or perceptual groups. (A) Capacity estimates for storing eight individual, ungrouped items (PmemSS8u) was plotted as a function of capacity estimates for storing eight elements organized into four perceptual groups (PmemSS8g). The regression function fitted to these data (solid black line) were statistically indistinguishable from a model assuming the storage of perceptual groups as a single unit (dotted black line; p = .66), whereas a model assuming the storage of individual elements was significantly different (dotted gray line; p < .0001). (B) Capacity estimates for storing four individual, ungrouped items (PmemSS4u) was plotted as a function of capacity estimates for storing eight elements organized into four perceptual groups (PmemSS8g). The regression function fitted to these data (solid black line) were statistically indistinguishable from a model assuming the storage of perceptual groups as a single unit (dotted black line; p = .34), whereas a model assuming the storage of individual elements was significantly different (dotted gray line; p < .0001).
Figure 3
Figure 3
Bilinear fits and individual differences analyses. (A) The precision by set size functions were fitted with a bilinear function for both the ungrouped (black line) and grouped (gray line) conditions. (B) Inflections in precision occurred at a later set size for both low (black) and high (white) WM capacity individuals (p < .001). Correlation (p < .001) between individual item limits and inflections in precision for ungrouped (C) and grouped (D) conditions, and the correlation (p < .01) between inflections in grouped and inflections in ungrouped conditions. Error bars represent the 95% confidence interval.
Figure 4
Figure 4
Stimulus displays and parameter estimates from Experiments 1b and c. (A) Precision by set size function and bilinear fit from Experiment 1b, which examined only grouped displays and extended the maximum set size to 12 items. The precision by set size function was fitted with a bilinear function (gray line), and the inflection point of the aggregate data was similar to the average inflection point obtained across observers (dotted black line). (B) Stimulus displays from Experiment 1c. Displays consisted of six elements each, with five elements that were radially arranged around a central element. For each of the five outer items, there were three possible orientation values, such that each possible orientation pointed directly towards the one of the nearest neighbors of that element. The central item could face any of the five peripheral items (C,D) Model parameters from Experiment 1c. A significant effect of grouping was observed for both SD (p < .05) and Pmem (p < .01) measures. Error bars represent the 95% confidence interval.
Figure 5
Figure 5
Precision and capacity estimates from Experiment 2. (A) The decline in precision across set size was significant for both grouped (dotted line) and ungrouped (solid line) conditions (p < .001), and the effect of grouping on precision was significant (p < .001). (B) The decline in the probability of storage across set size was significant for both grouped (dotted line) and ungrouped (solid line) conditions (p < .001), and the effect of grouping on the probability of storage was significant (p < .001). Error bars represent the 95% confidence interval.
Figure 6
Figure 6
(A) Grand averaged difference waves from P3/P4, PO3/PO4, and OL/OR electrodes. The gray bars indicate the temporal windows used to measure N2pc and CDA amplitudes. (B) N2pc amplitude as a function of set size and grouping condition. The increase in amplitude with set size (p < .001) and the decrease in amplitude in the grouped condition (red) relative to the ungrouped condition (blue) were significant (p < .01). (C) Correlation (p < .01) between the rise in N2pc amplitude with increasing set size as a function of capacity estimates (p < .01). (D) CDA amplitude as a function of set size and grouping condition. The increase in amplitude with set size (p < .01) and the decrease in amplitude in the grouped condition (red) relative to the ungrouped condition (blue) were significant (p < .001). (E) Correlation (p <) between the rise in CDA amplitude with increasing set size as a function of capacity estimates (p < .01). Error bars represent the 95% confidence interval.
Figure 7
Figure 7
(A) Grand averaged difference waves for critical conditions containing two perceived items (two ungrouped items and two grouped pairs of items). The gray bars indicate the temporal windows used to measure N2pc and CDA amplitudes. (B) N2pc amplitude and (C) CDA amplitude was equivalent between displays containing either two ungrouped items or two grouped pairs of items. Error bars represent the 95% confidence interval.

Comment in

  • Findings of research misconduct.
    [No authors listed] [No authors listed] NIH Guide Grants Contracts (Bethesda). 2015 Aug 14:NOT-OD-15-141. NIH Guide Grants Contracts (Bethesda). 2015. PMID: 26306340 Free PMC article. No abstract available.
  • Findings of Research Misconduct.
    [No authors listed] [No authors listed] Fed Regist. 2015 Jul 31;80(147):45661-45662. Fed Regist. 2015. PMID: 27737259 Free PMC article. No abstract available.

References

    1. Anderson DE, Vogel EK, Awh E. Precision in visual working memory reaches a stable plateau when individual item limits are exceeded. The Journal of Neuroscience. 2011;31:1128–1138. doi: 10.1523/JNEUROSCI.4125-10.2011. - DOI - PMC - PubMed
    1. Awh E, Barton B, Vogel EK. Visual working memory represents a fixed number of items regardless of complexity. Psychological Science. 2007;18:622–628. doi: 10.1111/j.1467-9280.2007.01949.x. - DOI - PubMed
    1. Barton B, Ester EF, Awh E. Discrete resource allocation in visual working memory. Journal of Experimental Psychology: Human Perception and Performance. 2009;35:1359–1367. doi: 10.1037/a0015792. - DOI - PMC - PubMed
    1. Bays PM, Catalao RFG, Husain M. The precision of visual working memory is set by allocation of a shared resource. Journal of Vision. 2009;9:7–11. doi: 10.1167/9.10.7. - DOI - PMC - PubMed
    1. Bays PM, Husain M. Dynamic shifts of limited working memory resources in human vision. Science. 2008;321:851–854. doi: 10.1126/science.1158023. - DOI - PMC - PubMed

Publication types