

doi: 10.1186/gb-2012-13-10-r98.
CHANCE: comprehensive software for quality control and validation of ChIP-seq data
- PMID: 23068444
- PMCID: PMC4053734
- DOI: 10.1186/gb-2012-13-10-r98
Item in Clipboard
CHANCE: comprehensive software for quality control and validation of ChIP-seq data
Genome Biol.
.
Abstract
ChIP-seq is a powerful method for obtaining genome-wide maps of protein-DNA interactions and epigenetic modifications. CHANCE (CHip-seq ANalytics and Confidence Estimation) is a standalone package for ChIP-seq quality control and protocol optimization. Our user-friendly graphical software quickly estimates the strength and quality of immunoprecipitations, identifies biases, compares the user's data with ENCODE's large collection of published datasets, performs multi-sample normalization, checks against quantitative PCR-validated control regions, and produces informative graphical reports. CHANCE is available at https://github.com/songlab/chance.
Figures

Statistical summary of IP enrichment strength. Each panel shows a summary statement of IP strength produced by CHANCE for a different sample. For each sample, CHANCE summary statements include: the statistical significance of IP enrichment, or the lack thereof; pie charts estimating the percentage of reads corresponding to DNA fragments pulled down by the antibody and the percentage of the genome enriched for biological signal; and, warning statements of possible bias or lack of sequencing depth. (a) The analysis results for H3K4me3 in human embryonic stem cells (HESCs; GEO GSM727572). Although this sample shows significant enrichment for signal, it also displays a possible lack of sufficient sequencing depth, which will result in a high false negative rate in peak detection. (b) The analysis results for H3K4me3 in mouse neural stem cells (NSCs). This sample shows decent enrichment, but CHANCE also detects an amplification bias in the input channel and alerts the user. (c) The results for the same sample as in (b) after bioinformatic de-duplication of reads. De-duplication has suppressed the amplification bias, recovering biological signal in the IP. The warning message has disappeared after de-duplication. (d) The summary statement for CARM1 in HESCs (GEO GSM801064). For this sample, the IP appeared extremely weak; CHANCE is unable to produce pie chart enrichment estimates as in the previous samples, but it nevertheless reports the false discovery rate (FDR) associated with the test for enrichment. There are four false discovery rates reported, each estimated on a separate subset of training data. Their abbreviations are as follows, HC: histone mark - cancer tissue; HN: histone mark - normal tissue; TC: transcription factor binding site - cancer tissue; TN: transcription factor binding site - normal tissue.
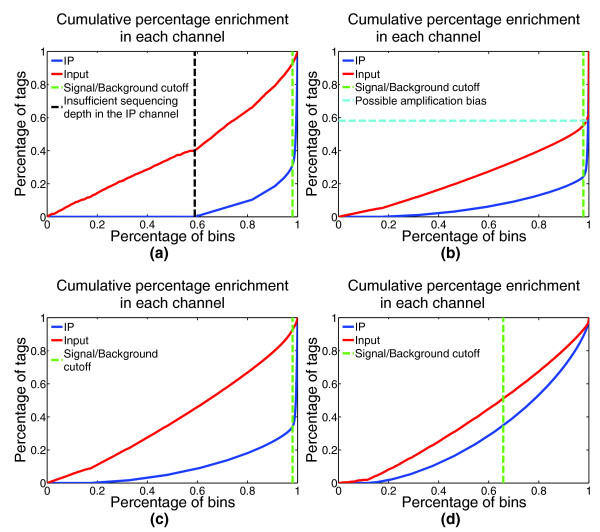
Graphical summary of IP enrichment. In addition to summary statements, CHANCE produces graphical visualizations of IP strength by separating background regions from ChIP-enriched regions. For a complete discussion on the statistical interpretation of these plots, see [1]. Briefly, points on the x-axis correspond to percentages of the genome, and points on the y-axis correspond to percentages of the total number of reads. The point at which the distance between the IP and Input percentages is maximized is denoted by the green line; the greater the separation between IP and Input at this point, the better the IP enrichment. The shapes of the two curves also provide useful information about the data. (a) The IP curve for H3K4me3 in human embryonic stem cells (HESCs; GEO GSM727572) stays near 0 until it reaches 0.6, indicating that 60% of the genome did not have sufficient coverage in the IP channel. CHANCE detects this insufficient sequencing depth and indicates the percentage of uncovered genome by a black line. (b) For H3K4me3 in mouse neural stem cells (NSCs), CHANCE indicates amplification bias with a turquoise line, identifying over 60% of the reads mapping to a small percentage of the genome. (c) The same sample as in (b) is shown after de-duplication. CHANCE does not detect any amplification bias after de-duplication. (d) This figure exemplifies a weak IP (CARM1 in HESCs; GEO GSM801064), where the IP and Input curves are not well separated.

Multi-IP normalization. This figure shows CHANCE output for the multi-IP normalization module. (a-d) CHANCE produces a summary statement (a-b), a pairwise sample differential enrichment matrix (c-d), and a graphical representation of the normalization process. The graphical representation gives the same type of plot as in IP strength estimation for each IP sample, as well as the consensus of the IP samples; see Materials and methods. The summary statement quantifies the graphical representation by giving the statistical significance of the difference of each sample from the consensus. The differential enrichment matrix computes the percentage of the genome differentially enriched between all pairs of samples, using the same technique for IP-Input comparison used in IP strength estimation; see Materials and methods. (a,c,e) Multi-IP normalization of H3K4me1, H3K4me2, H3K4me3, and H3K36me3 in human embryonic stem cells (H1 HESCs), from the Broad ENCODE data. (b,d,f) The capacity of CHANCE multi-IP normalization to detect batch effects. The clustering of technical replicates (denoted by 1 and 2) for each biological replicate (denoted by A and B) seen in (f) is quantified in the pairwise differential enrichment matrix (d), which shows a statistically insignificant percentage of the genome differentially enriched between replicates but a non-negligible percentage of the genome differentially enriched between batches.
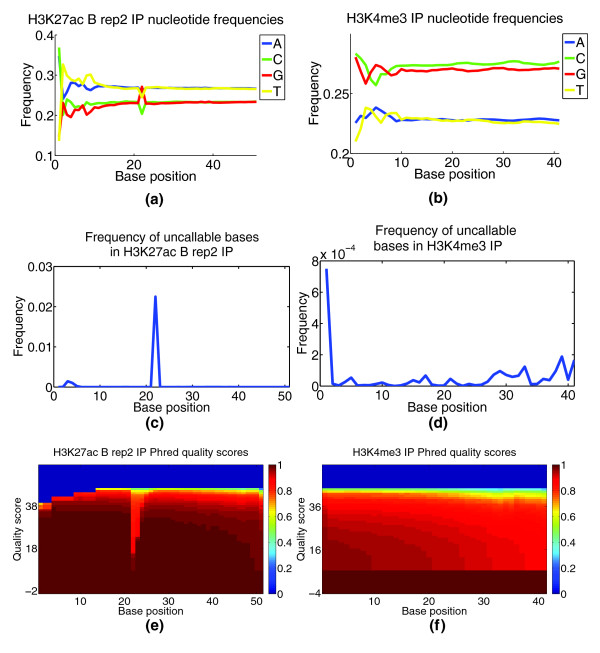
Base call content and quality bias. This figure demonstrates CHANCE output for base call content and quality bias module. (a,b) Plot of nucleotide frequency as a function of base position. (c,d) Plot of the frequency of uncallable bases as a function of base position. (e,f) Heat maps of Phred quality scores, where the x-axis corresponds to base position and the y-axis to Phred quality score. The color of a given (x,y) pair gives 1 minus the cumulative density of reads with a quality score of y or less. That is, it gives the fraction of reads with a quality score of y or more; so, the redder, the better. (a,c,e) H3K27ac IP in mouse whole limb from the Ahituv lab at UCSF. These samples show a marked drop in quality, a rise in uncallable bases, and an abrupt change in nucleotide frequencies for positions 22 to 24, indicating potential problems with the sequencing. For comparison, (b,d,f) show results for H3K4me3 IP from mouse NSCs from the Lim lab at UCSF, which exhibit relatively low bias.
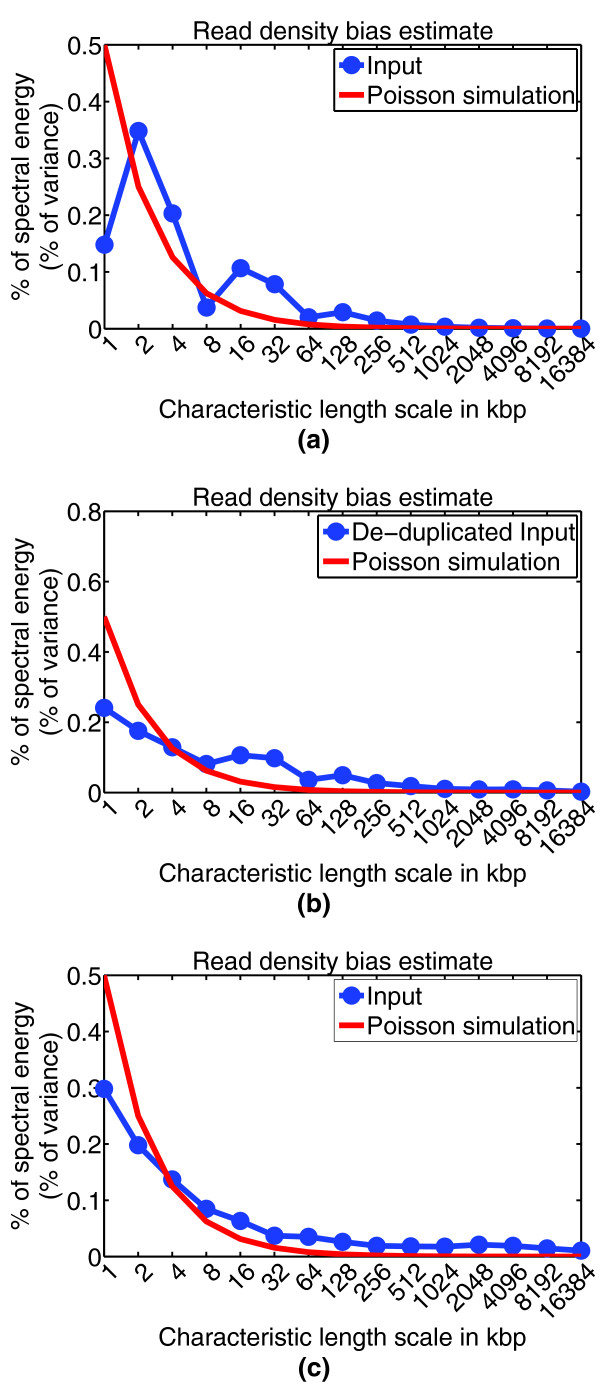
Read density bias. This figure shows CHANCE output for the read density bias estimation module. The x-axis denotes length scale, from 1 kbp to 16.384 Mbp. The y-axis denotes percentage of variance in data at a given length scale (spectral energy). The blue curve is the user's data, while the red curve denotes the distribution of an idealized bias-free data set generated by a Poisson simulation (see Materials and methods). Noticeable deviation of the blue curve from the red simulation curve might indicate copy number alterations in cancer cells, amplification bias in generating duplicate reads, GC content and mappability bias, or inability to sonicate heterochromatin regions. (a) Mouse NSC Input from the Lim lab with significant IP enrichment, but also with a heavy amplification bias in the input channel. (b) After de-duplicating reads, the sample in (a) shows a reduction in bias as demonstrated by a better agreement between the user's data and the Poisson simulation (compare Figures 1b,c and 2b,c). (c) For comparison, this panel shows mouse whole limb Input from the Ahituv lab, which demonstrates relatively low bias in read density.
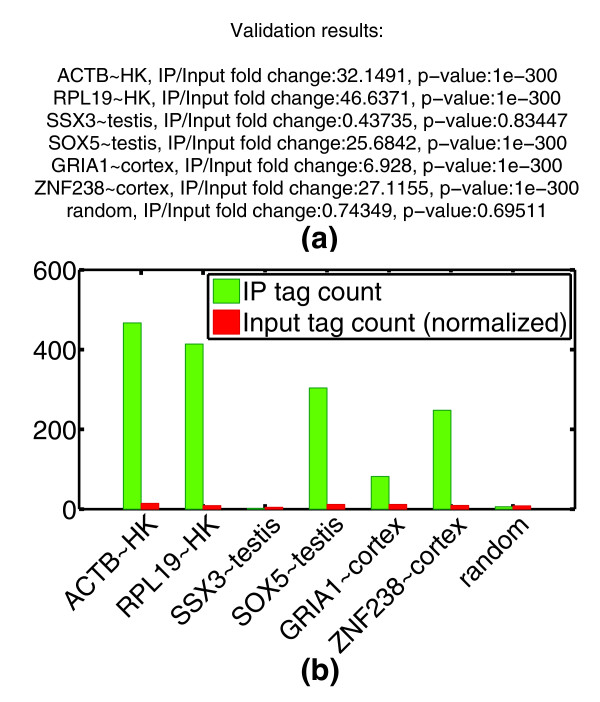
Spot validation. This figure demonstrates CHANCE's spot validation module. H3K4me3 in H1 HESCs from the Broad ENCODE data is spot validated for promoter regions of known housekeeping and tissue-specific genes. (a) The summary statement gives the IP over Input fold-change in read count as well as a P-value based on a Poisson null model (see Materials and methods). A random locus is added for comparison. The putative proximal promoter was estimated to 3 kbp upstream to 3 kbp downstream of the transcription start site. (b) Graphical representation of the results. On the x-axis, we have the gene symbols followed by the tissue type with which their expression is commonly identified; HK denotes 'house keeping' or ubiquitously expressed genes. The y-axis shows the number of reads mapping to the corresponding promoter region, both in IP and Input.
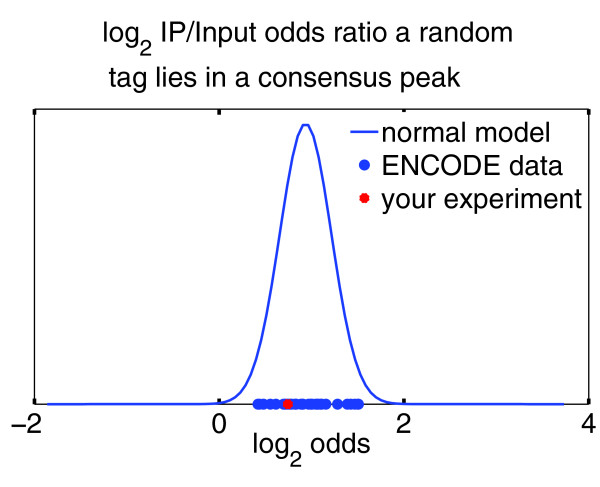
Comparison with ENCODE. CHANCE can quickly compare the user's experiment with thousands of other experiments in the ENCODE repository. This figure shows CHANCE's output for H3K27me3 ENCODE data from the Broad Institute. On the x-axis is the IP over Input odds ratio that a randomly chosen read from the user's sample will lie in the union of all peaks of all ENCODE samples for the same transcription factor or epigenetic mark as the user's ChIP. The blue bell curve is a probabilistic model fitted to all available data. The blue circles denote all available data sets from ENCODE, and the red star is the user's sample. Intuitively, the user's sample has a poor overlap with the ENCODE data if the red star lies in the extreme left tail. The figure shows that the H3K27me3 sample is not an outlier when compared to other ENCODE samples.
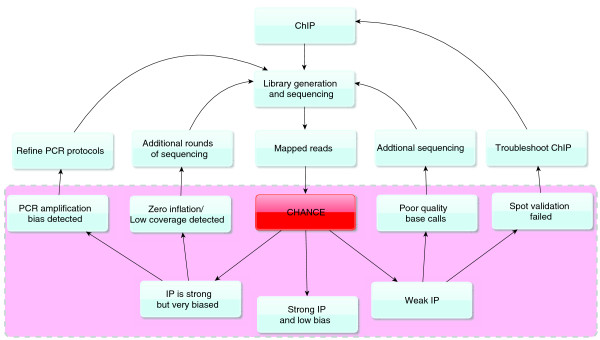
A typical workflow with CHANCE. CHANCE can provide a scientist with feedback regarding the success of their experiment, as well as how their protocols may be improved. CHANCE is designed to work with reads mapped to a reference genome. The dotted pink region illustrates the useful quality metrics computed by CHANCE to assess a ChIP-seq experiment. One can use these intuitive results to determine if the experiment is satisfactory or if additional protocol modification or sequencing is required.

The divergence test statistic by sample type. These box plots show the distributions of the divergence test statistic for IP-Input and Input-Input comparisons for the ENCODE training data grouped into sample types: (a) histone mark in cancer cells; (b) histone mark in normal cells; (c) TF in cancer cells; and (d) TF in normal cells. The distributions of the divergence test statistic have slightly stronger mixing for histone data (a,b) compared to TF data (c,d), as evidenced by the higher whiskers in the TF IP-Input box plots. Moreover, the Input-Input comparisons for cancer samples (a,c) show a greater number of outliers denoted by red plus signs with large divergence test values compared to normal samples (b,d). To account for these differences, CHANCE estimates false discovery rates separately for each sample type. TFBS, transcription factor binding site.
References
-
- Avardis NGS. http://www.avadis-ngs.com/
