. 2013 Feb:50:59-68.
doi: 10.1016/j.nbd.2012.10.003. Epub 2012 Oct 12.

Critical role of neuronal pentraxin 1 in mitochondria-mediated hypoxic-ischemic neuronal injury

Affiliations

Critical role of neuronal pentraxin 1 in mitochondria-mediated hypoxic-ischemic neuronal injury

Md Al Rahim et al. Neurobiol Dis. 2013 Feb.

Abstract

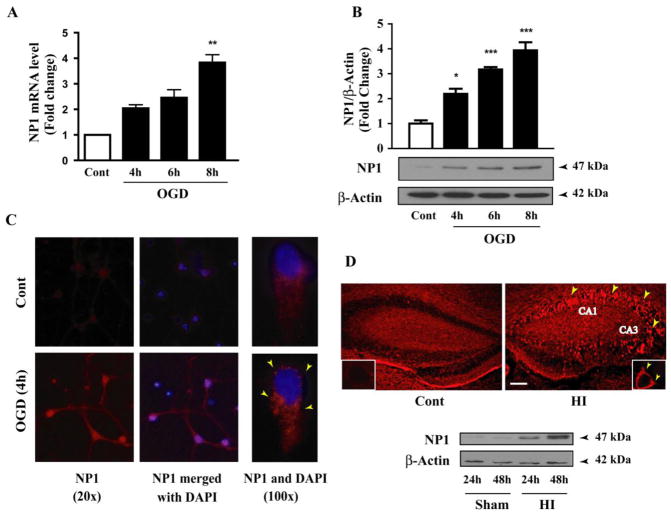
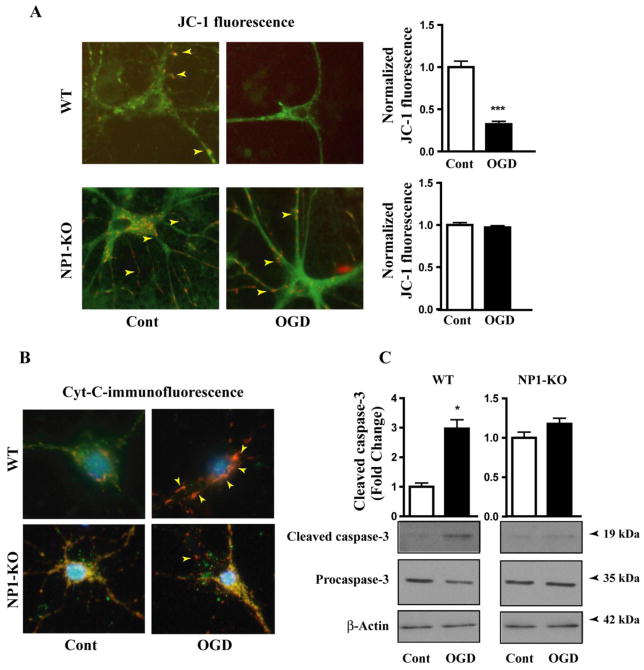
Developing brain is highly susceptible to hypoxic-ischemic (HI) injury leading to severe neurological disabilities in surviving infants and children. Previously, we have reported induction of neuronal pentraxin 1 (NP1), a novel neuronal protein of long-pentraxin family, following HI neuronal injury. Here, we investigated how this specific signal is propagated to cause the HI neuronal death. We used wild-type (WT) and NP1 knockout (NP1-KO) mouse hippocampal cultures, modeled in vitro following exposure to oxygen glucose deprivation (OGD), and in vivo neonatal (P9-10) mouse model of HI brain injury. Our results show induction of NP1 in primary hippocampal neurons following OGD exposure (4-8 h) and in the ipsilateral hippocampal CA1 and CA3 regions at 24-48 h post-HI compared to the contralateral side. We also found increased PTEN activity concurrent with OGD time-dependent (4-8 h) dephosphorylation of Akt (Ser473) and GSK-3β (Ser9). OGD also caused a time-dependent decrease in the phosphorylation of Bad (Ser136), and Bax protein levels. Immunofluorescence staining and subcellular fractionation analyses revealed increased mitochondrial translocation of Bad and Bax proteins from cytoplasm following OGD (4 h) and simultaneously increased release of Cyt C from mitochondria followed by activation of caspase-3. NP1 protein was immunoprecipitated with Bad and Bax proteins; OGD caused increased interactions of NP1 with Bad and Bax, thereby, facilitating their mitochondrial translocation and dissipation of mitochondrial membrane potential (ΔΨ(m)). This NP1 induction preceded the increased mitochondrial release of cytochrome C (Cyt C) into the cytosol, activation of caspase-3 and OGD time-dependent cell death in WT primary hippocampal neurons. In contrast, in NP1-KO neurons there was no translocation of Bad and Bax from cytosol to the mitochondria, and no evidence of ΔΨ(m) loss, increased Cyt C release and caspase-3 activation following OGD; which resulted in significantly reduced neuronal death. Our results indicate a regulatory role of NP1 in Bad/Bax-dependent mitochondrial release of Cyt C and caspase-3 activation. Together our findings demonstrate a novel mechanism by which NP1 regulates mitochondria-driven hippocampal cell death; suggesting NP1 as a potential therapeutic target against HI brain injury in neonates.


Figures

Fig. 1
Fig. 1
NP1 is induced in primary hippocampal cultures exposed to OGD and in the hippocampus of neonatal mice after HI. A) Total RNA was extracted and NP1 mRNA expression levels were analyzed by quantitative real-time PCR. Fold induction is the ratio of NP1 to internal control HPRT, which remained stable through the OGD period (values are mean±SEM, n=3; **p<0.01). B) Total cellular proteins were analyzed by SDS-PAGE and immunoblotted for NP1 protein. The NP1 antibody used was very specific and only detected distinct single band of molecular size at 47 kDa. Bands were quantified by densitometry and normalized to β-actin (mean±SEM, n=3; *p<0.05, ***p<0.001). C) Live immunostaining of cultured hippocampal neurons with NP1 specific antibody showed increased number of NP1-expressing neurons following OGD (low magnification, 20X) compared to the normoxic cultures, and neurons showing NP1 immunoreactivity at higher magnification (100X). D) Representative coronal brain sections (20 μm) of ipsi-, and contralateral sides of hippocampus from 48 h post-HI were analyzed for NP1-specific immunofluorescence (red) at low (10X) magnifications and at higher magnifications (100X; inset). Scale bars: 100 μm. Yellow arrows specify NP1 immunostaining. Representative Western blot image of NP1 level in the hippocampus of mice sacrificed 24 and 48 h post-HI (bottom panel). Each experiment was conducted in triplicate. Representative blots are shown.
Fig. 2
Fig. 2
OGD exposure of WT hippocampal neurons causes cell death, while neurons from NP-TKO and NP1-KO mice are protected. A) Quantification of cell death by LDH release revealed OGD-induced (6h) cell death in WT but not in NP-TKO and NP1-KO hippocampal neuronal cultures. Data is expressed as LDH release normalized to normoxic controls (mean±SEM, n=6; **p<0.01, **p<0.001). B) Bright field morphological images of WT, NP-TKO and NP1-KO neurons exposed to OGD (6h). Black arrows indicate dying cells, and fragmented processes of the WT neurons following OGD exposure.
Fig. 3
Fig. 3
Effects of OGD exposure on the phosphorylation of GSK-3β in WT and NP-KO cultures. Total cellular proteins from WT (A), NP-TKO (B) and NP1-KO (C) hippocampal cultures were immunoblotted for phospho-GSK-3β (Ser 9) and total GSK-3β using respective primary antibodies. The quantitative densitometric analyses correspond to the phospho-GSK-3β normalized to total GSK-3β. In addition, β-actin bands shown also served as a loading control. Values are mean ± SEM. (n=3; *p<0.05, ***p<0.001). D, E) Cells were exposed to OGD with or without pretreatment with SB216763 (10μM for 12h), a GSK-3 inhibitor. Western immunoblotting shows decrease in OGD-induced NP1-induction when pretreated with SB216763. Bands were quantified by densitometry and normalized to β-actin (mean ± SEM, n=3; **p<0.01) (D). Cell cytotoxicity was measured by LDH release. Results were presented as mean ± SEM. (n=5; **p<0.01, ***p<0.001) (E).
Fig. 4
Fig. 4
Effects of OGD on phospho-Bad and Bax in WT and NP1-KO hippocampal neuronal cultures. Total cellular proteins from WT (left panel) and NP1-KO (right panel) hippocampal cultures were analyzed by Western blot using phospho-Bad (s136) and Bax antibodies, followed by reprobing with β-actin specific antibody. (A) Phosphorylation of Bad and the Bax protein levels remained unchanged, at least, up to 46h of OGD in NP1-KO hippocampal neurons. (B) The quantitative densitometric analyses correspond to the phospho-Bad (s136) and Bax protein normalized to β-actin. Values are presented as mean ± SEM. (n=3; *p<0.05, **p<0.01, ***p<0.001). Representative blots are shown.
Fig. 5
Fig. 5
NP1 is associated with the mitochondrial translocation of Bad and Bax and subsequent Cyt C release from the mitochondria. Subcellular fractionation of total cellular extracts from WT and NP1-KO hippocampal cultures was performed following 4 h of OGD exposure. Western blot analysis showed differential distribution of Bad, Bax and Cyt C between the cytosolic (A) and mitochondrial (B) fractions from WT hippocampal cultures after OGD. In contrast, Bad, Bax and Cyt C protein levels remained unchanged in cytoplasm and mitochondrial fractions from NP1-KO cultures (A & B). VDAC and actin were used as a control for purity of the mitochondrial and cytosolic fraction, respectively, which also serve as loading controls. SDS-PAGE and immunoblotting of Bad (C) and Bax (D) immunoprecipitates from total cellular extracts revealed an OGD-induced increase in NP1 co-precipitation relative to normoxic neurons, whereas pretreatment with SB216763 (10μM for 12h) reversed the OGD-evoked increase of NP1 immunoprecipitates. IgG immunoprecipitates showed no evidence of NP1-, Bad- and Bax-specific bands. Representative blots are shown.
Fig. 6
Fig. 6
OGD induced mitochondrial membrane potential (ΔΨm) loss, Cyt C release, activation of caspase-3, and subsequent cell death in WT but not NP1-KO hippocampal neuronal cultures. A) Mitochondrial ΔΨm was examined in WT and NP1-KO hippocampal neurons exposed to OGD (2h) using JC-1 fluorescence dye. OGD exposed WT cells showed significant loss of ΔΨm (yellow arrows; ***p<0.001), but not in NP1-KO cells, compared to that in control normoxia cells. The JC-1 fluorescence was normalized as the control red-to-green ratio taken as 1. B) Control normoxia and OGD (4h) exposed WT and NP1−/− hippocampal neurons were immunostained with Cyt C (red), mitochondrial marker VDAC (green) and DAPI-stained nucleus of cells (blue) using respective primary antibody. Cyt C was detected predominantly in the mitochondria (yellow) in the WT control normoxia cells. OGD exposure resulted Cyt C release from mitochondria to cytosol (red) of WT hippocampal neurons but no Cyt C release was evident in NP1−/− neurons after OGD. Arrows show Cyt C-specific immunofluorescence. C) Western immunoblot of total cellular proteins from WT (left) and NP1-KO (right) hippocampal neurons using cleaved and procaspase-3 specific antibodies detected increased cleaved caspase-3 immunoreactive protein band in WT neurons. In contrast, cleaved caspase-3 specific band remained at the basal levels in NP1-KO cultures as compared to normoxia controls. β-actin band was visualized as loading control. Values are presented as mean ± SEM. (n=3; *p<0.05, ***p<0.001). Representative blots are shown.
Fig. 7
Fig. 7
Schematic diagram proposing a potential NP1-mediated mitochondrial cell death mechanism. Ischemia causes inactivation of Akt by activating PTEN followed by GSK-3 stimulation, which induces NP1 expression. NP1 promotes apoptotic pathways by facilitating the mitochondrial translocation of Bad and Bax, thereby releasing Cyt C into the cytosol, ensuing caspase-3 activation and cell death. Inhibiting NP1 expression by using a GSK-3 inhibitor SB (SB216763) or knocking down of NP1 gene provides neuroprotection (shown in green) by preventing mitochondrial Bad/Bax translocation, Cyt C release and caspase-3 activation evoked by OGD.

References

    1. Armstrong JS, Jones DP. Glutathione depletion enforces the mitochondrial permeability transition and causes cell death in Bcl-2 overexpressing HL60 cells. FASEB J. 2002;16:1263–1265. - PubMed
    1. Balduini W, Carloni S, Mazzoni E, Cimino M. New therapeutic strategies in perinatal stroke. Curr Drug Targets CNS Neurol Disord. 2004;3(4):315–23. - PubMed
    1. Banasiak KJ, Xia Y, Haddad GG. Mechanisms underlying hypoxia-induced neuronal apoptosis. Prog Neurobiol. 2000;62:215–249. - PubMed
    1. Berbari NF, Bishop GA, Askwith CC, Lewis JS, Mykytyn K. Hippocampal neurons possess primary cilia in culture. J Neurosci Res. 2007;85:1095–1100. - PubMed
    1. Blomgren K, Zhu C, Hallin U, Hagberg H. Mitochondria and ischemic reperfusion damage in the adult and in the developing brain. Biochem Biophys Res Commun. 2003;304(3):551–9. - PubMed

Publication types