

Reduction of intimal hyperplasia in injured rat arteries promoted by catheter balloons coated with polyelectrolyte multilayers that contain plasmid DNA encoding PKCδ
- PMID: 23069712
- PMCID: PMC3483441
- DOI: 10.1016/j.biomaterials.2012.09.010
Reduction of intimal hyperplasia in injured rat arteries promoted by catheter balloons coated with polyelectrolyte multilayers that contain plasmid DNA encoding PKCδ
Abstract
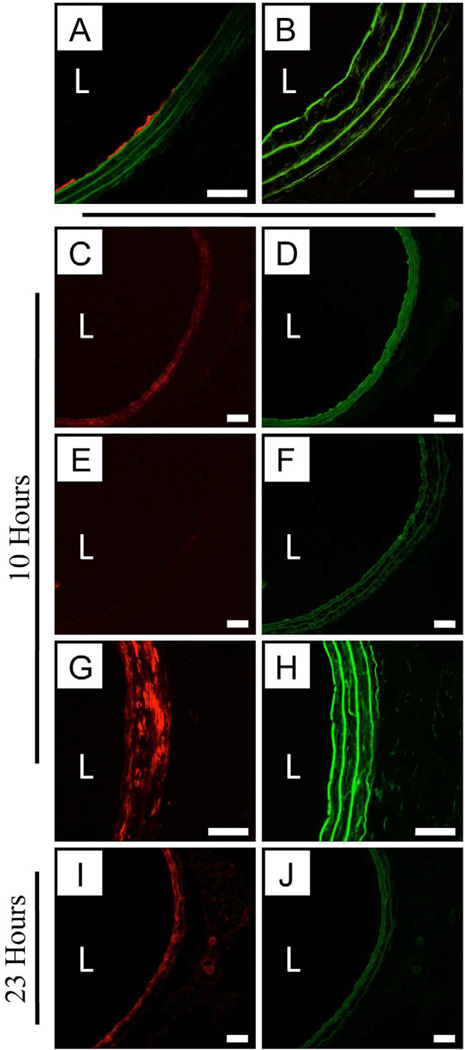
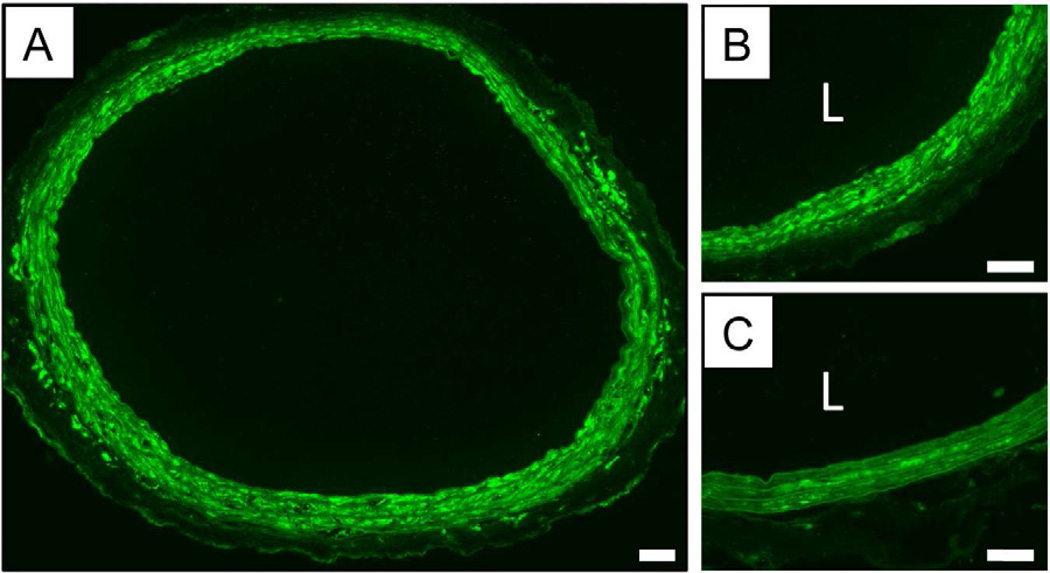
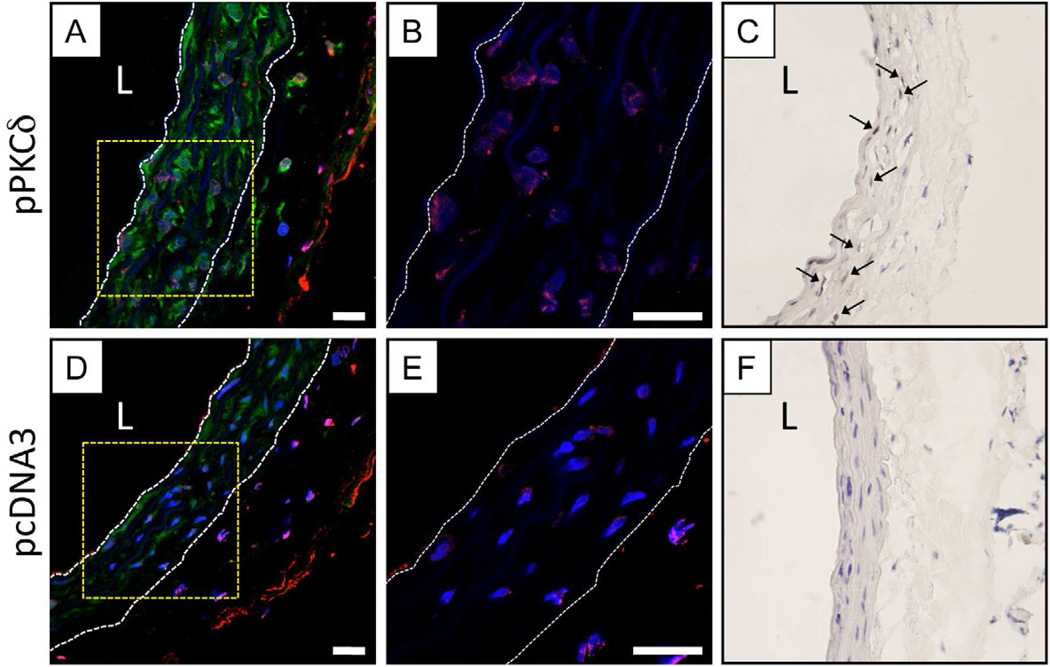
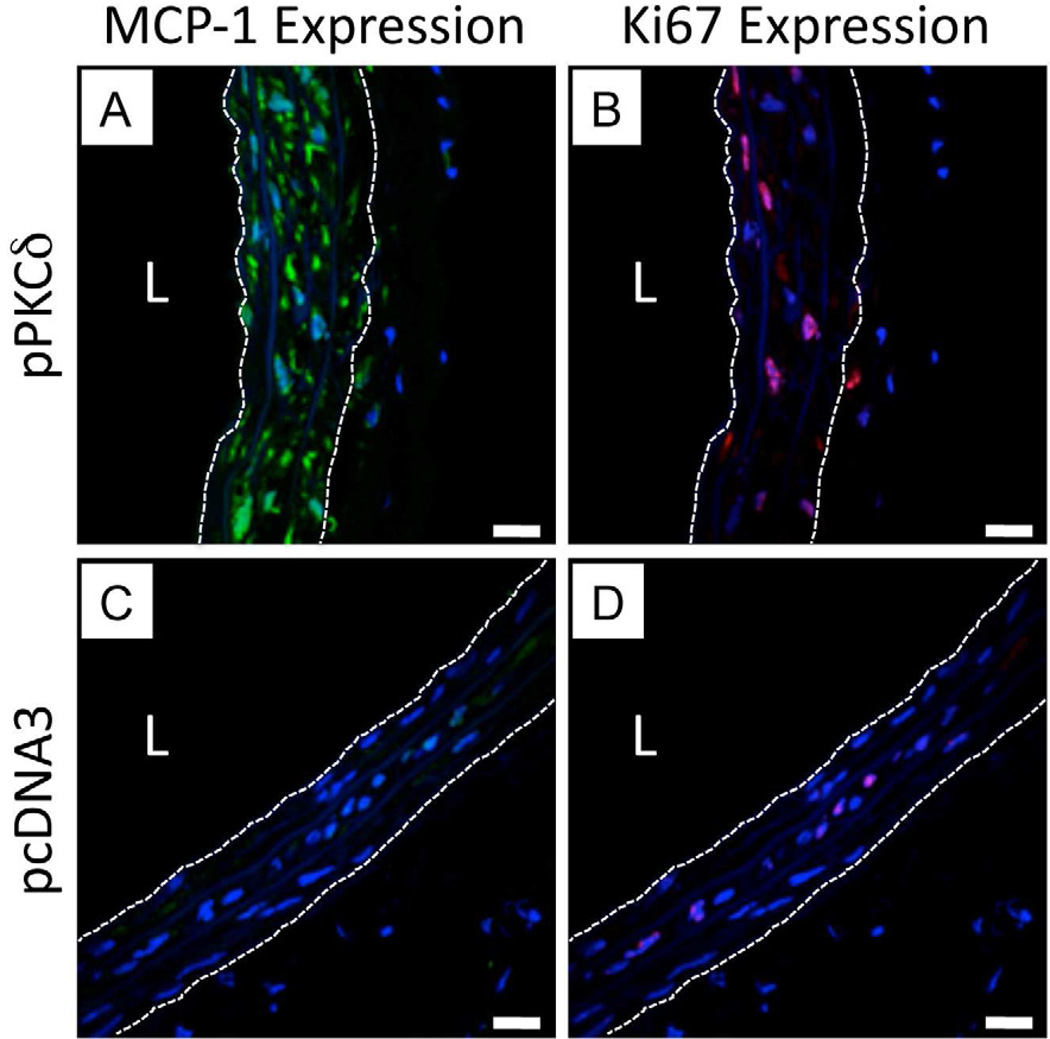
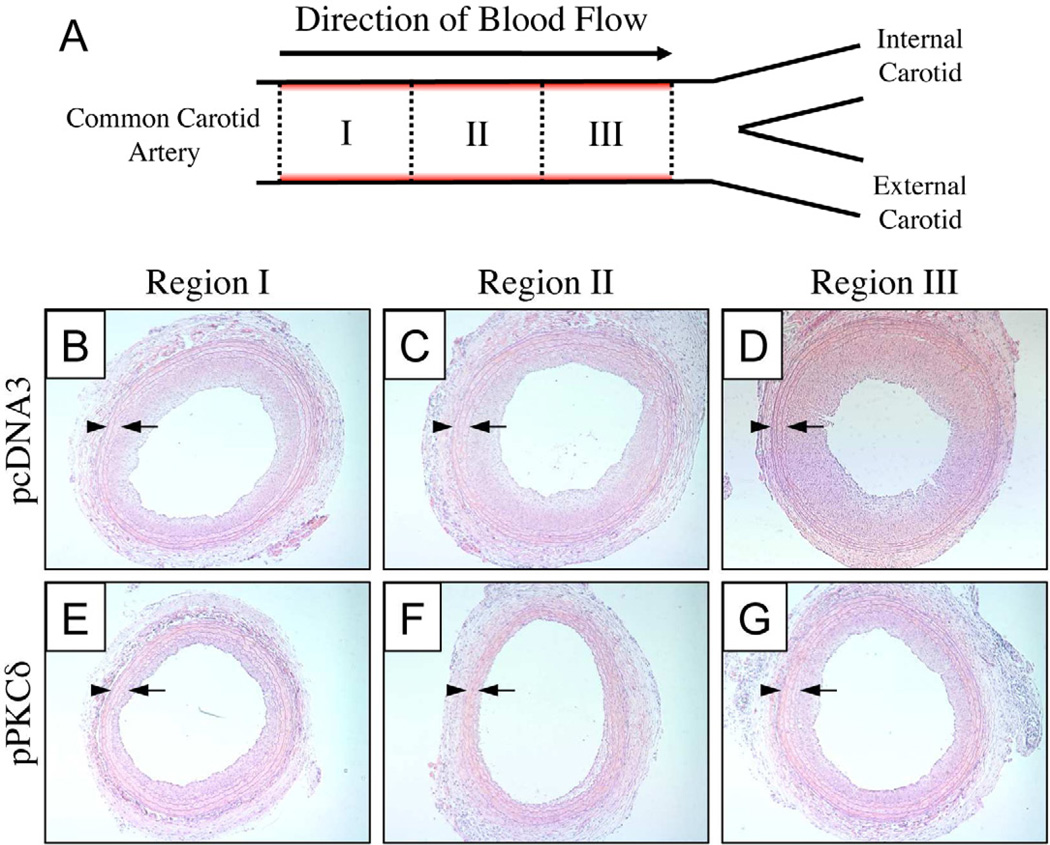
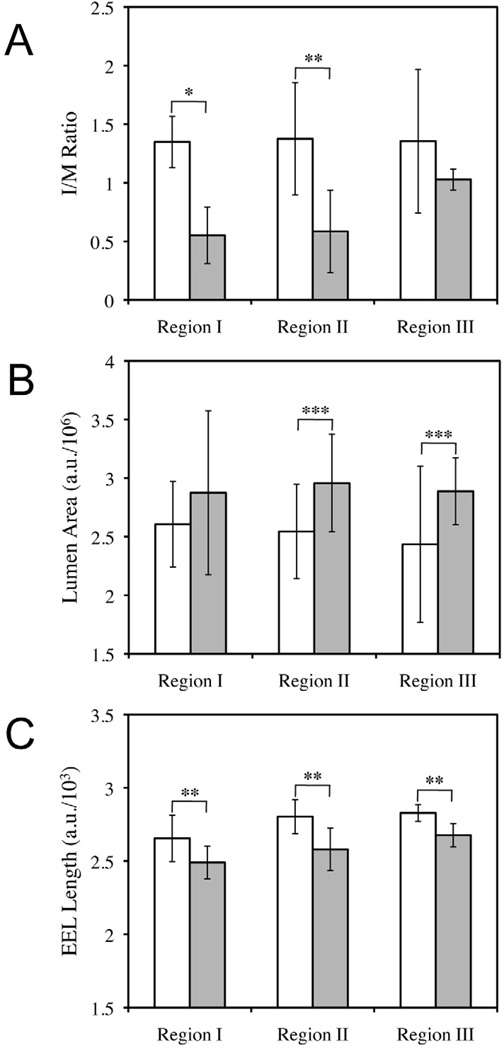
New therapeutic approaches that eliminate or reduce the occurrence of intimal hyperplasia following balloon angioplasty could improve the efficacy of vascular interventions and improve the quality of life of patients suffering from vascular diseases. Here, we report that treatment of arteries using catheter balloons coated with thin polyelectrolyte-based films ('polyelectrolyte multilayers', PEMs) can substantially reduce intimal hyperplasia in an in vivo rat model of vascular injury. We used a layer-by-layer (LbL) process to coat the surfaces of inflatable catheter balloons with PEMs composed of nanolayers of a cationic poly(β-amino ester) (polymer 1) and plasmid DNA (pPKCδ) encoding the δ isoform of protein kinase C (PKCδ), a regulator of apoptosis and other cell processes that has been demonstrated to reduce intimal hyperplasia in injured arterial tissue when administered via perfusion using viral vectors. Insertion of balloons coated with polymer 1/pPKCδ multilayers into injured arteries for 20 min resulted in local transfer of DNA and elevated levels of PKCδ expression in the media of treated tissue three days after delivery. IFC and IHC analysis revealed these levels of expression to promote downstream cellular processes associated with up-regulation of apoptosis. Analysis of arterial tissue 14 days after treatment revealed polymer 1/pPKCδ-coated balloons to reduce the occurrence of intimal hyperplasia by ~60% compared to balloons coated with films containing empty plasmid vectors. Our results demonstrate the potential therapeutic value of this nanotechnology-based approach to local gene delivery in the clinically important context of balloon-mediated vascular interventions. These PEM-based methods could also prove useful for other in vivo applications that require short-term, surface-mediated transfer of plasmid DNA.
Copyright © 2012 Elsevier Ltd. All rights reserved.
Figures
Similar articles
-
Polyelectrolyte multilayers promote stent-mediated delivery of DNA to vascular tissue.Biomacromolecules. 2013 May 13;14(5):1696-704. doi: 10.1021/bm4005222. Epub 2013 May 2. Biomacromolecules. 2013. PMID: 23597075 Free PMC article.
-
Delivery of plasmid DNA to vascular tissue in vivo using catheter balloons coated with polyelectrolyte multilayers.Biomaterials. 2011 Jan;32(2):610-8. doi: 10.1016/j.biomaterials.2010.09.009. Epub 2010 Oct 8. Biomaterials. 2011. PMID: 20933275 Free PMC article.
-
Protein kinase C delta mediates arterial injury responses through regulation of vascular smooth muscle cell apoptosis.Cardiovasc Res. 2010 Feb 1;85(3):434-43. doi: 10.1093/cvr/cvp328. Epub 2009 Oct 6. Cardiovasc Res. 2010. PMID: 19808702 Free PMC article.
-
Pioglitazone enhances cytokine-induced apoptosis in vascular smooth muscle cells and reduces intimal hyperplasia.Circulation. 2001 Jul 24;104(4):455-60. doi: 10.1161/hc3001.092040. Circulation. 2001. PMID: 11468209
-
Multilayered polyelectrolyte assemblies as platforms for the delivery of DNA and other nucleic acid-based therapeutics.Adv Drug Deliv Rev. 2008 Jun 10;60(9):979-99. doi: 10.1016/j.addr.2008.02.010. Epub 2008 Mar 4. Adv Drug Deliv Rev. 2008. PMID: 18395291 Free PMC article. Review.
Cited by
-
Polyelectrolyte multilayers promote stent-mediated delivery of DNA to vascular tissue.Biomacromolecules. 2013 May 13;14(5):1696-704. doi: 10.1021/bm4005222. Epub 2013 May 2. Biomacromolecules. 2013. PMID: 23597075 Free PMC article.
-
Coronary artery bypass grafting hemodynamics and anastomosis design: a biomedical engineering review.Biomed Eng Online. 2013 Dec 13;12:129. doi: 10.1186/1475-925X-12-129. Biomed Eng Online. 2013. PMID: 24330653 Free PMC article. Review.
-
Spatio-Temporal Control of LbL Films for Biomedical Applications: From 2D to 3D.Adv Healthc Mater. 2015 Apr 22;4(6):811-30. doi: 10.1002/adhm.201400715. Epub 2015 Jan 27. Adv Healthc Mater. 2015. PMID: 25627563 Free PMC article. Review.
-
Controlling the surface-mediated release of DNA using 'mixed multilayers'.Bioeng Transl Med. 2016 Jun;1(2):181-192. doi: 10.1002/btm2.10023. Epub 2016 Aug 26. Bioeng Transl Med. 2016. PMID: 27981243 Free PMC article.
-
Capillary flow layer-by-layer: a microfluidic platform for the high-throughput assembly and screening of nanolayered film libraries.ACS Nano. 2014 Jul 22;8(7):6580-9. doi: 10.1021/nn501963q. Epub 2014 May 22. ACS Nano. 2014. PMID: 24836460 Free PMC article.
References
-
- Mueller RL, Sanborn TA. The history of interventional cardiology - cardiac-catheterization, angioplasty, and related interventions. Am Heart J. 1995;129:146–172. - PubMed
-
- Norgren L, Hiatt WR, Dormandy JA, Nehler MR, Harris KA, Fowkes FGR, et al. Inter-society consensus for the management of peripheral arterial disease (tasc ii) J Vasc Surg. 2007;45:S5–S67. - PubMed
-
- Liu MW, Roubin GS, King SB. Restenosis after coronary angioplasty - potential biologic determinants and role of intimal hyperplasia. Circulation. 1989;79:1374–1387. - PubMed
-
- Elezi S, Kastrati A, Hadamitzky M, Dirschinger J, Neumann FJ, Schomig A. Clinical and angiographic follow-up after balloon angioplasty with provisional stenting for coronary in-stent restenosis. Catheter Cardiovasc Interv. 1999;48:151–156. - PubMed
-
- Sharif F, Daly K, Crowley J, O'Brien T. Current status of catheter- and stent-based gene therapy. Cardiovasc Res. 2004;64:208–216. - PubMed
Publication types
MeSH terms
Substances
Grants and funding
LinkOut - more resources
Full Text Sources
Other Literature Sources
Research Materials
