

Case-mix adjusted hospital mortality is a poor proxy for preventable mortality: a modelling study
- PMID: 23069860
- PMCID: PMC3551201
- DOI: 10.1136/bmjqs-2012-001202
Case-mix adjusted hospital mortality is a poor proxy for preventable mortality: a modelling study
Abstract
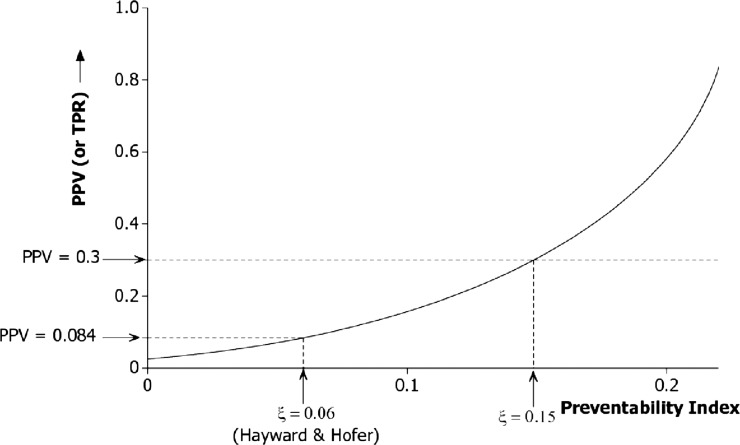
Risk-adjustment schemes are used to monitor hospital performance, on the assumption that excess mortality not explained by case mix is largely attributable to suboptimal care. We have developed a model to estimate the proportion of the variation in standardised mortality ratios (SMRs) that can be accounted for by variation in preventable mortality. The model was populated with values from the literature to estimate a predictive value of the SMR in this context-specifically the proportion of those hospitals with SMRs among the highest 2.5% that fall among the worst 2.5% for preventable mortality. The extent to which SMRs reflect preventable mortality rates is highly sensitive to the proportion of deaths that are preventable. If 6% of hospital deaths are preventable (as suggested by the literature), the predictive value of the SMR can be no greater than 9%. This value could rise to 30%, if 15% of deaths are preventable. The model offers a 'reality check' for case mix adjustment schemes designed to isolate the preventable component of any outcome rate.
Figures
References
-
- Department of Health and Human Services Medicare Hospital Mortality Information 1986. Washington, DC: Government Printing Office, 1987
-
- Blumberg MS. Biased estimates of expected acute myocardial infarction mortality using MedisGroups admission severity groups. JAMA 1991;265:2965–70 - PubMed
-
- Greenfield S, Aronow HU, Elashoff RM, et al. Flaws in mortality data. The hazards of ignoring comorbid disease. JAMA 1988;260:2253–5 - PubMed
-
- Hofer TP, Hayward RA. Identifying poor-quality hospitals. Can hospital mortality rates detect quality problems for medical diagnoses? Med Care 1996;34:737–53 - PubMed
-
- Park RE, Brook RH, Kosecoff J, et al. Explaining variations in hospital death rates. Randomness, severity of illness, quality of care. JAMA 1990;264:484–90 - PubMed
Publication types
MeSH terms
Grants and funding
LinkOut - more resources
Full Text Sources