. 2013 Mar;21(3):629-37.
doi: 10.1038/mt.2012.210. Epub 2012 Oct 16.

T cells redirected to EphA2 for the immunotherapy of glioblastoma

Affiliations

T cells redirected to EphA2 for the immunotherapy of glioblastoma

Kevin K H Chow et al. Mol Ther. 2013 Mar.

Abstract

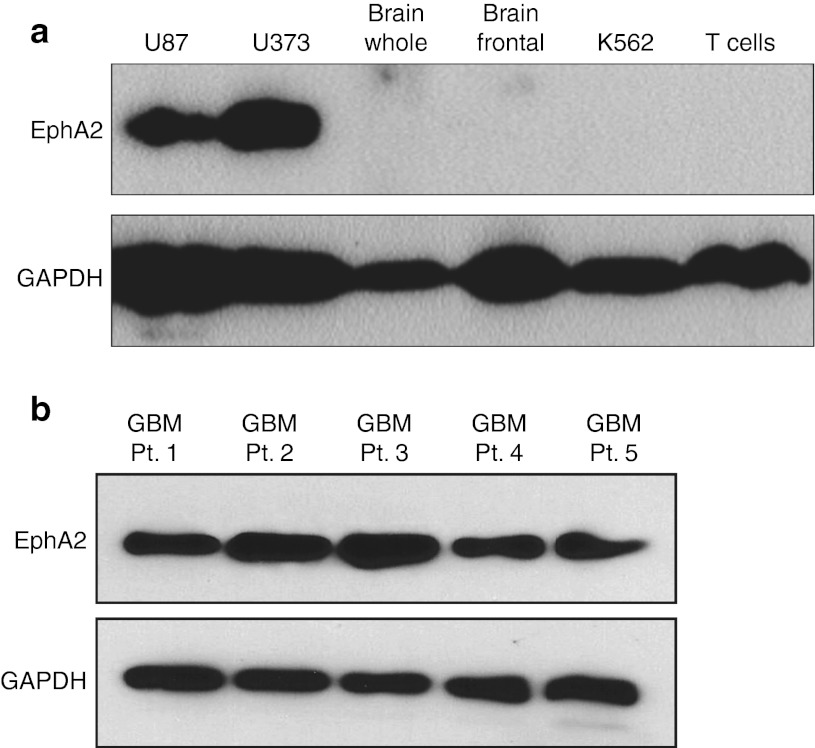
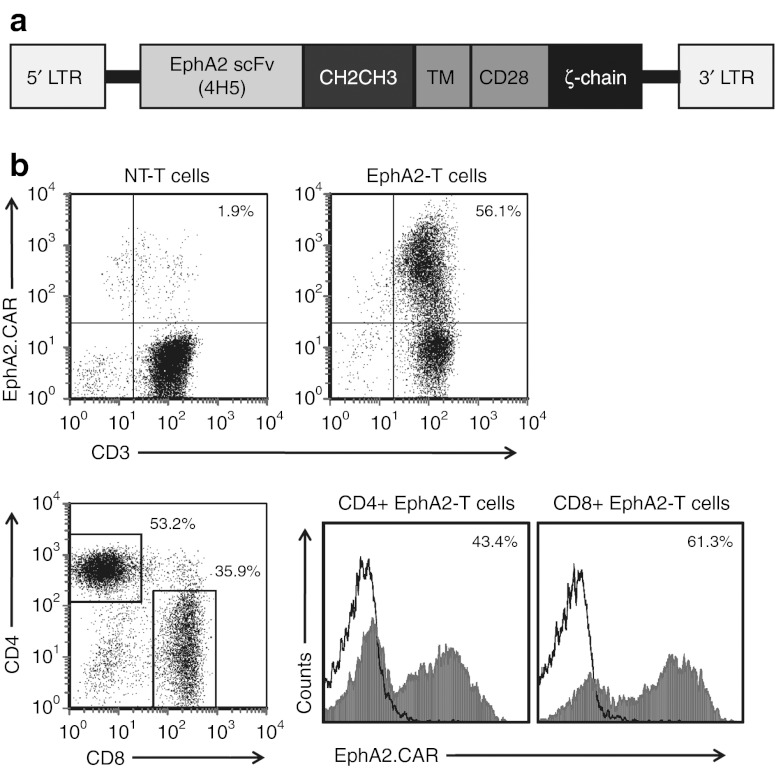
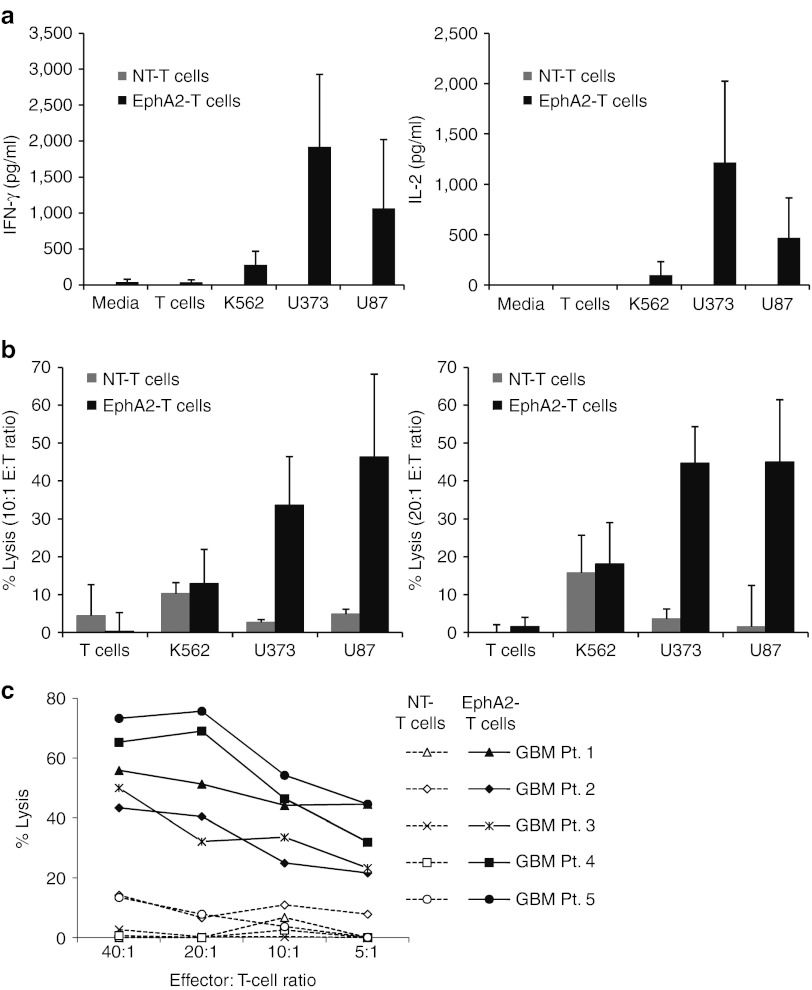
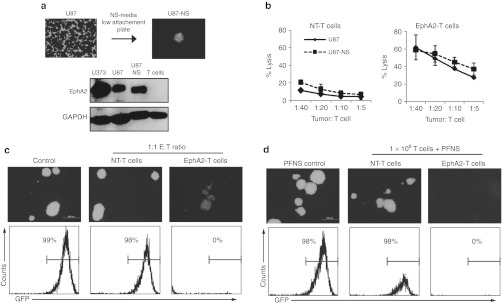
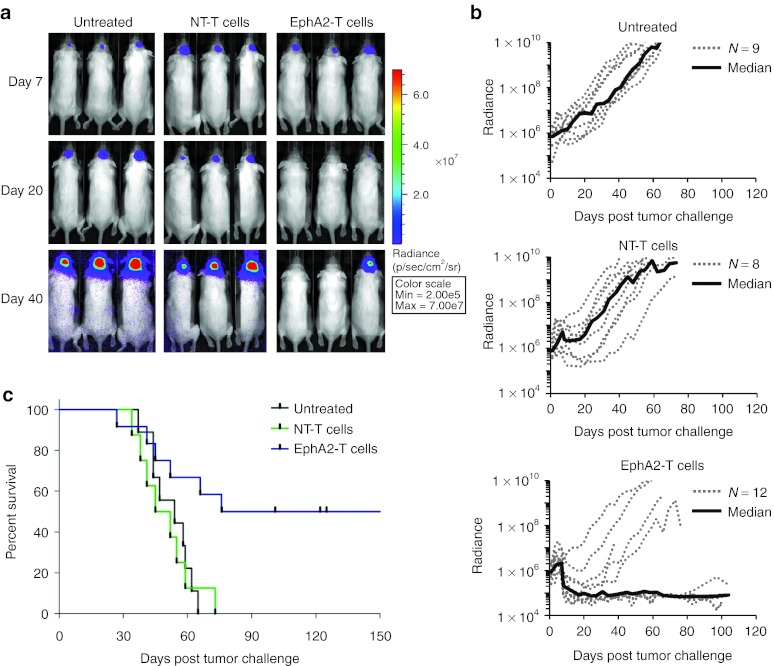
Outcomes for patients with glioblastoma (GBM) remain poor despite aggressive multimodal therapy. Immunotherapy with genetically modified T cells expressing chimeric antigen receptors (CARs) targeting interleukin (IL)-13Rα2, epidermal growth factor receptor variant III (EGFRvIII), or human epidermal growth factor receptor 2 (HER2) has shown promise for the treatment of gliomas in preclinical models and in a clinical study (IL-13Rα2). However, targeting IL-13Rα2 and EGFRvIII is associated with the development of antigen loss variants, and there are safety concerns with targeting HER2. Erythropoietin-producing hepatocellular carcinoma A2 (EphA2) has emerged as an attractive target for the immunotherapy of GBM as it is overexpressed in glioma and promotes its malignant phenotype. To generate EphA2-specific T cells, we constructed an EphA2-specific CAR with a CD28-ζ endodomain. EphA2-specific T cells recognized EphA2-positive glioma cells as judged by interferon-γ (IFN-γ) and IL-2 production and tumor cell killing. In addition, EphA2-specific T cells had potent activity against human glioma-initiating cells preventing neurosphere formation and destroying intact neurospheres in coculture assays. Adoptive transfer of EphA2-specific T cells resulted in the regression of glioma xenografts in severe combined immunodeficiency (SCID) mice and a significant survival advantage in comparison to untreated mice and mice treated with nontransduced T cells. Thus, EphA2-specific T-cell immunotherapy may be a promising approach for the treatment of EphA2-positive GBM.


Figures

Figure 1
Figure 1
Erythropoietin-producing hepatocellular carcinoma A2 (EphA2) is expressed in glioma but not in normal brain. (a) Western blot showed high expression of EphA2 in the glioma cell lines U87 and U373. EphA2 was not detectable in normal brain tissue (whole brain or frontal lobe), K562, or normal T cells. (b) EphA2 was detected in 5/5 primary cell lines established from tumors of patients with GBM. GAPDH, glyceraldehyde 3-phosphate dehydrogenase; GBM, glioblastoma.
Figure 2
Figure 2
Generation of erythropoietin-producing hepatocellular carcinoma A2 (EphA2)-specific T cells. (a) The EphA2-specific chimeric antigen receptors (CAR) was generated by cloning a single chain variable fragment derived from the EphA2 monoclonal antibody 4H5 upstream of an IgG1-CH2CH3 domain, a CD28 TM domain, and costimulatory domains derived from CD28 and CD3-ζ into an SFG retroviral vector. (b) EphA2-CAR expression was detected by staining T cells with a CH2CH3 antibody. Fluorescence activated cell sorting analysis revealed expression of EphA2-specific CARs on the cell surface of transduced T cells as compared with controls (median = 73.2%, n = 7, range = 49.9–95.0%, representative plot shown). Transduced T cells consisted of CD4- and CD8-positive cells with both subsets expressing EphA2-specific CARs. LTR, long terminal repeats; NT, nontransduced; TM, transmembrane.
Figure 3
Figure 3
Erythropoietin-producing hepatocellular carcinoma A2 (EphA2)-specific T cells recognize and kill EphA2-positive gliomas. (a) Nontransduced (NT) or EphA2-specific T cells were cocultured with target cells at a 1:5 ratio, and after 24 hours, the production of interferon-γ (IFN-γ) and interleukin- 2 (IL-2) by T cells was determined by ELISA. EphA2-specific T cells produced significantly higher levels of IFN-γ (U373 versus K562 P = 0.006; U373 versus T cells P = 0.007; U87 versus K562 P = 0.049; U87 versus T cells P = 0.034); and IL-2 (U373 versus K562 P = 0.011; U373 versus T cells P = 0.014; U87 versus K562 P = 0.018; U87 versus T cells P = 0.029) in response to EphA2-positive targets U373 and U87 than to EphA2-negative targets K562 and normal T cells (mean + SD; n = 5). (b) EphA2-specific T cells were tested in 4-hour chromium release assays. EphA2-specific T cells had significant cytotoxic activity against U373 and U87 whereas NT-T cells did not at effector to target (E:T) ratios of 10:1 (left panel) or 20:1 (right panel; U373: P < 0.0004; U87 P < 0.002 at both E:T ratios). There was no difference between both effector T-cell populations for EphA2-negative targets (T cells: P > 0.15; K562: P > 0.27 at both E:T ratios; mean + SD; n = 5). (c) Cytotoxicity assays with EphA2-specific T cells and NT-T cells as effectors and five primary EphA2-positive glioblastoma cell lines as targets.
Figure 4
Figure 4
Erythropoietin-producing hepatocellular carcinoma A2 (EphA2)-specific T cells inhibit neurosphere formation and destroy established neurospheres. (a) Neurospheres were formed by culturing U87.eGFP.FFLuc in neurosphere (NS) media on low-attachment plates. Western blot showed that these U87-neurospheres expressed an equivalent amount of EphA2 as compared with U87 cells cultured in monolayer. (b) EphA2-specific T cells killed U87-NS in a 4-hour chromium release assay (mean + SD; n = 2). (c) Nontransduced (NT) or EphA2-specific T cells were plated with U87-NS cells at a 1:1 ratio in neurosphere media on low-attachment plates. Although NT-T cells had no effect on the ability of U87-NS cells to form neurospheres, EphA2-specific T cells prevented neurosphere formation as shown by fluorescence microscopy and fluorescence activated cell sorting (FACS) analysis for GFP-positive U87-NS. (d) 1 × 10⁶ NT or EphA2-specific T cells were plated with PFNS. Only EphA2-specific T cells were able to destroy preformed neurospheres as judged by fluorescence microscopy and FACS analysis for GFP-positive U87-NS (data shown are representative of two independent experiments). GAPDH, glyceraldehyde 3-phosphate dehydrogenase; GFP, green fluorescent protein; PFNS, preformed U87-NS.
Figure 5
Figure 5
Erythropoietin-producing hepatocellular carcinoma A2 (EphA2)-specific T cells induce regression of established glioblastoma in vivo. 1 × 10⁵ U373.eGFP.FFLuc were injected intracranially into severe combined immunodeficiency mice on day 0 and treated with a single injection of 2 × 10⁶ EphA2-specific T cells into the same tumor coordinates on day 7. Untreated mice and mice treated with nontransduced (NT) T cells served as controls. (a) Bioluminescence imaging was used to follow tumor progression. All mice had detectable tumors just prior to treatment (day 7). By day 40, all mice in the control groups had progressive tumors (9/9 for untreated, 8/8 for NT-T cells). The tumor signal decreased in all mice treated with EphA2-specific T cells, and 50% (6/12) were long-term survivors. (b) The bioluminescence signal from the tumors (radiance = photons/sec/cm2/sr) over time. Dotted lines represent each individual mouse while the solid black line represents the median radiance for the group at the given time. (c) Mice treated with EphA2-specific T cells had a significantly prolonged survival compared with untreated (P = 0.009) and NT-T cell (P = 0.010) treated mice. There was no significant difference between the survival of untreated versus NT-T cell treated mice (P = 0.852).
Figure 6
Figure 6
Antitumor activity of erythropoietin-producing hepatocellular carcinoma A2 (EphA2)-specific T cells in vivo depends on T-cell number and tumor size. (a) 5 × 10⁵ EphA2-specific T cells were injected intratumorally on day 7 or (b) 2 × 10⁶ EphA2-specific T cells on day 14. All mice (n = 4) injected on day 7 had a regression of their tumors with one mouse having a complete response (CR). Two of four mice treated on day 14 had a response, including one CR. (c) Mice with day 7 tumors received 1 × 10⁷ EphA2-specific T cells intravenously through their tail vein (n = 4). No antitumor effects were observed. (d) Kaplan–Meier survival curve of all treated groups of mice.

References

    1. DeAngelis LM. Brain tumors. N Engl J Med. 2001;344:114–123. - PubMed
    1. Stupp R, Mason WP, van den Bent MJ, Weller M, Fisher B, Taphoorn MJ.et al. (2005Radiotherapy plus concomitant and adjuvant temozolomide for glioblastoma N Engl J Med 352987–996. - PubMed
    1. Stupp R, Hegi ME, Mason WP, van den Bent MJ, Taphoorn MJ, Janzer RC.et al. (2009Effects of radiotherapy with concomitant and adjuvant temozolomide versus radiotherapy alone on survival in glioblastoma in a randomised phase III study: 5-year analysis of the EORTC-NCIC trial Lancet Oncol 10459–466. - PubMed
    1. Okada H, Kalinski P, Ueda R, Hoji A, Kohanbash G, Donegan TE.et al. (2011Induction of CD8+ T-cell responses against novel glioma-associated antigen peptides and clinical activity by vaccinations with {alpha}-type 1 polarized dendritic cells and polyinosinic-polycytidylic acid stabilized by lysine and carboxymethylcellulose in patients with recurrent malignant glioma J Clin Oncol 29330–336. - PMC - PubMed
    1. Sampson JH, Heimberger AB, Archer GE, Aldape KD, Friedman AH, Friedman HS.et al. (2010Immunologic escape after prolonged progression-free survival with epidermal growth factor receptor variant III peptide vaccination in patients with newly diagnosed glioblastoma J Clin Oncol 284722–4729. - PMC - PubMed

Publication types