Randomized Controlled Trial
. 2012 Oct 16;157(8):549-57.
doi: 10.7326/0003-4819-157-8-201210160-00005.

Impaired insulin signaling in human adipocytes after experimental sleep restriction: a randomized, crossover study

Affiliations
Randomized Controlled Trial

Impaired insulin signaling in human adipocytes after experimental sleep restriction: a randomized, crossover study

Josiane L Broussard et al. Ann Intern Med. .

Abstract

Background: Insufficient sleep increases the risk for insulin resistance, type 2 diabetes, and obesity, suggesting that sleep restriction may impair peripheral metabolic pathways. Yet, a direct link between sleep restriction and alterations in molecular metabolic pathways in any peripheral human tissue has not been shown.

Objective: To determine whether sleep restriction results in reduced insulin sensitivity in subcutaneous fat, a peripheral tissue that plays a pivotal role in energy metabolism and balance.

Design: Randomized, 2-period, 2-condition, crossover clinical study.

Setting: University of Chicago Clinical Resource Center.

Participants: Seven healthy adults (1 woman, 6 men) with a mean age of 23.7 years (SD, 3.8) and mean body mass index of 22.8 kg/m(2) (SD, 1.6).

Intervention: Four days of 4.5 hours in bed or 8.5 hours in bed under controlled conditions of caloric intake and physical activity.

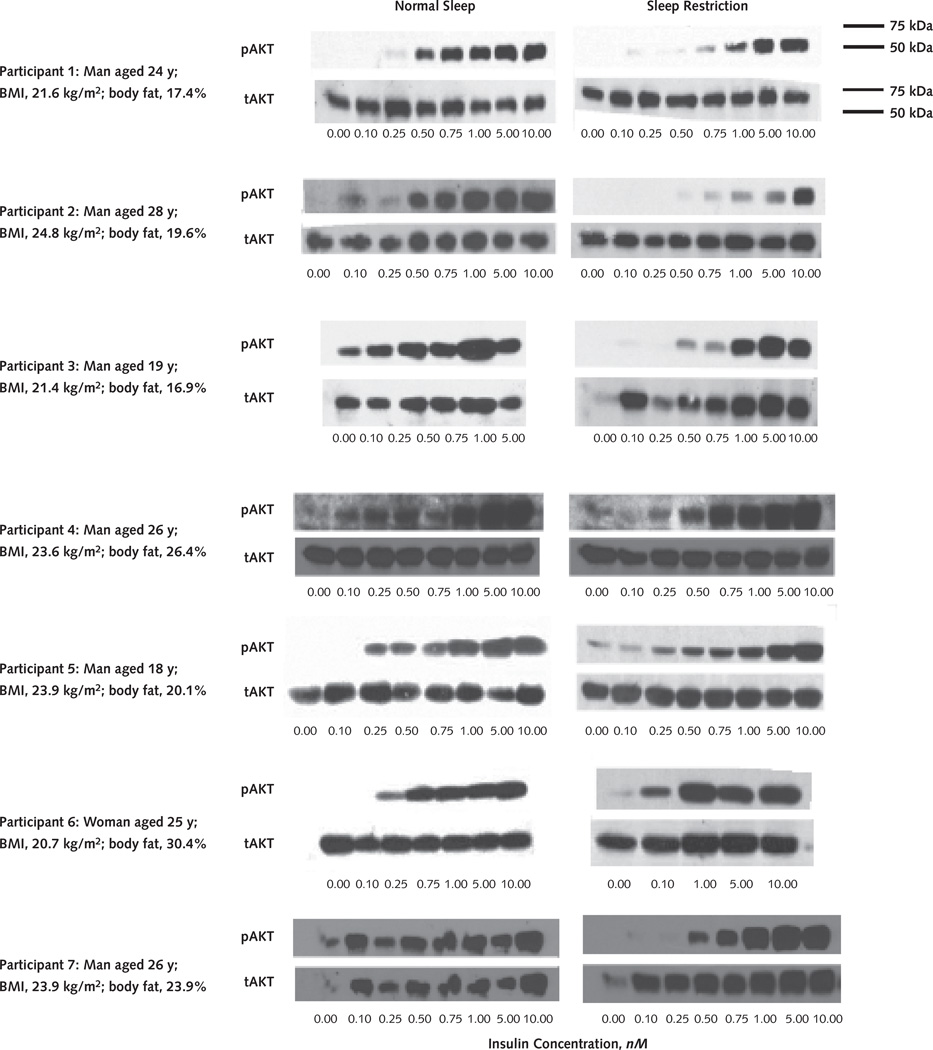
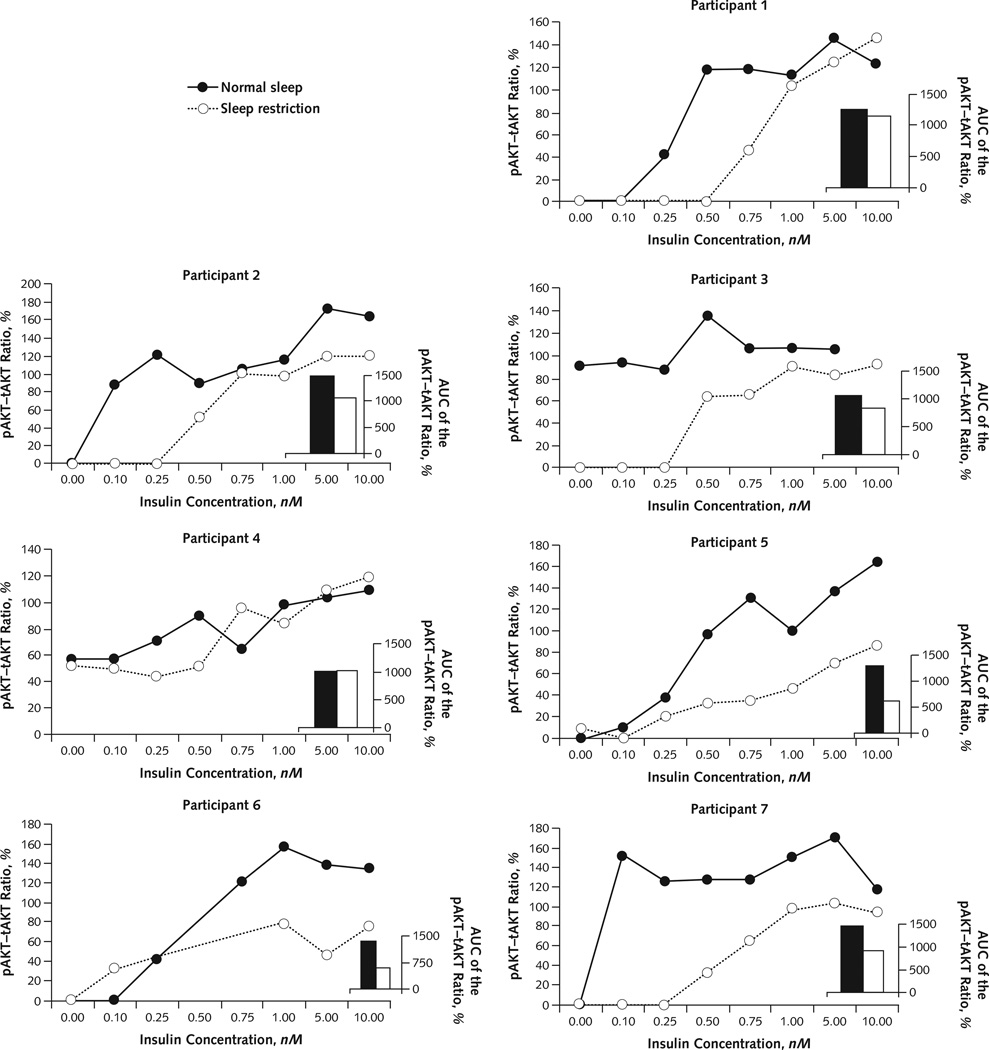
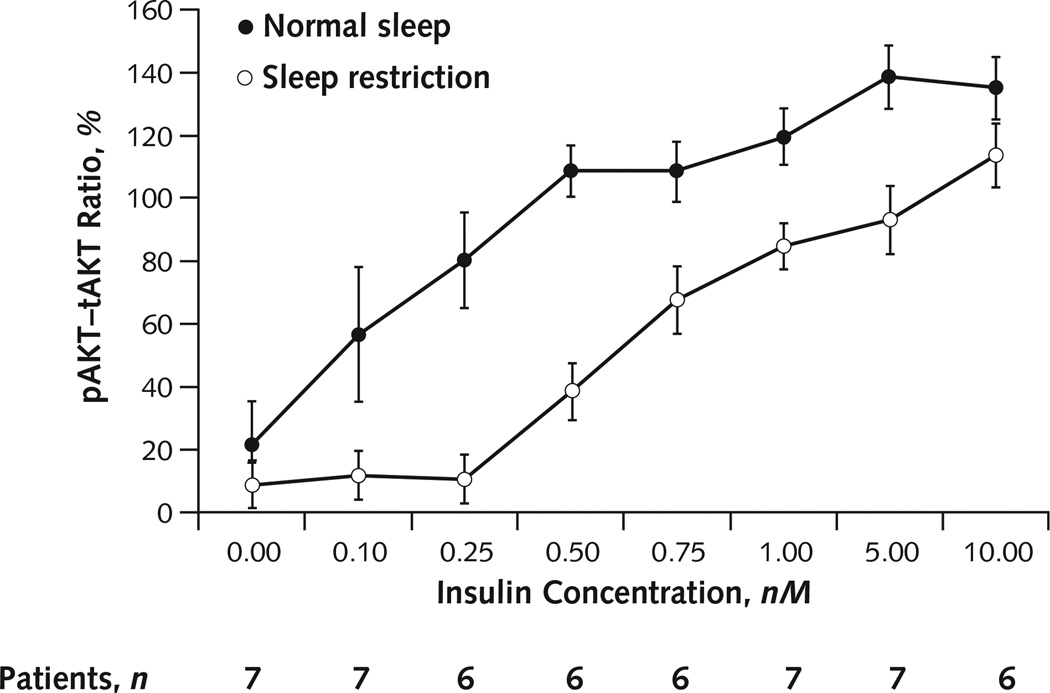
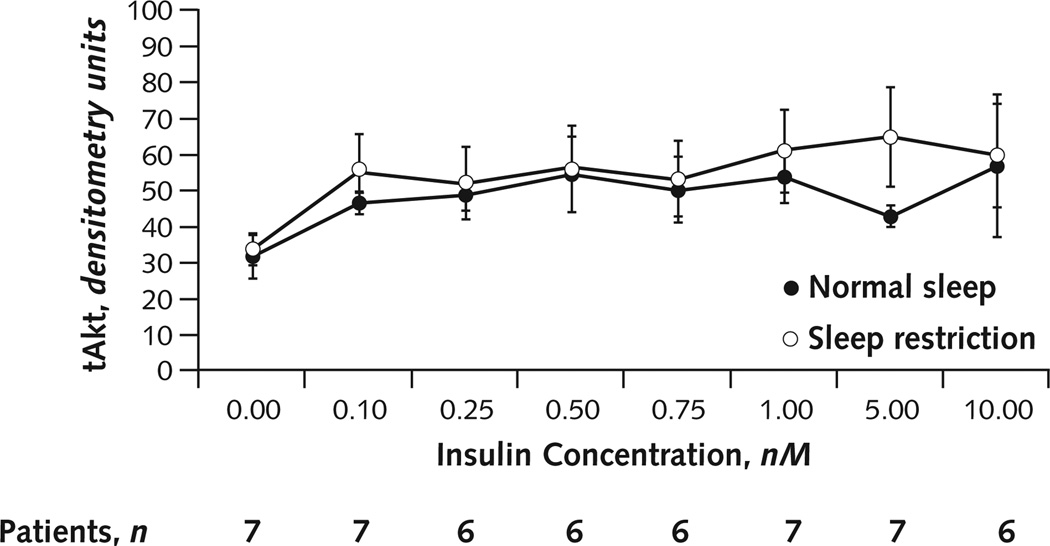
Measurements: Adipocytes collected from subcutaneous fat biopsy samples after normal and restricted sleep conditions were exposed to incremental insulin concentrations. The ability of insulin to increase levels of phosphorylated Akt (pAkt), a crucial step in the insulin-signaling pathway, was assessed. Total Akt (tAkt) served as a loading control. The insulin concentration for the half-maximal stimulation of the pAkt-tAkt ratio was used as a measure of cellular insulin sensitivity. Total body insulin sensitivity was assessed using a frequently sampled intravenous glucose tolerance test.

Results: The insulin concentration for the half-maximal pAkt-tAkt response was nearly 3-fold higher (mean, 0.71 nM [SD, 0.27] vs. 0.24 nM [SD, 0.24]; P = 0.01; mean difference, 0.47 nM [SD, 0.33]; P = 0.01), and the total area under the receiver-operating characteristic curve of the pAkt-tAkt response was 30% lower (P = 0.01) during sleep restriction than during normal sleep. A reduction in total body insulin sensitivity (P = 0.02) paralleled this impaired cellular insulin sensitivity.

Limitation: This was a single-center study with a small sample size.

Conclusion: Sleep restriction results in an insulin-resistant state in human adipocytes. Sleep may be an important regulator of energy metabolism in peripheral tissues.

Primary funding source: National Institutes of Health.


Conflict of interest statement

Potential Conflicts of Interest: Disclosures can be viewed at www.acponline.org/authors/icmje/ConflictOfInterestForms.do?msNum_M12-0056.

Figures

Figure 1
Figure 1. Insulin signaling in the adipocytes
Individual Western blot tests show anti-pAkt and anti-tAkt responses to incremental increases in insulin concentrations in adipocytes under normal sleep and sleep restriction. Subcutaneous fat biopsies were performed on the same participants after normal sleep or sleep restriction conditions. Adipocytes were isolated by collagenase digestion, and isolated adipocytes were incubated in duplicate with increasing concentrations of insulin (0.00–10.00 nM). Samples were then frozen. All samples from the same participant from both sleep conditions were analyzed simultaneously by pAkt immunoblotting using identical exposure times. The same membranes were then stripped and reprobed with tAkt antibodies. The samples were not run on the same gel because of size constraints, but the 2 gels were transferred at the same time and the 2 membranes were processed in the same container. Molecular weight markers are shown on the upper right. Individual values for sex, age, BMI, and percentage of body fat (determined by an impedance technique) are provided for each participant. BMI = body mass index; pAkt = phosphorylated Akt; tAkt = total Akt.
Figure 2
Figure 2. Densitometric quantification of pAkt–tAkt response
Individual densitometric quantification of the dose-dependent responses of the pAkt–tAkt ratio to insulin stimulation in each participant under normal sleep and sleep restriction. Because of insufficient volume of biopsy samples, insulin concentrations of 0.25, 0.50, and 0.75 nM (under sleep restriction) and 0.50 nM (under normal sleep) in participant 6 and 10.00 nM (under normal sleep) in participant 3 were omitted. At an insulin concentration of 0.00 nM in participants 1, 2, 6, and 7 and 0.10 nM in participant 1, there was no measurable pAkt activation under either sleep condition; therefore, the data shown are superimposed. Note that pAkt and tAkt are measured using different antibodies; thus, the pAkt–tAkt ratio can vary outside of the range of 0% to 100%. AUC = area under the receiver-operating characteristic curve; pAkt = phosphorylated Akt; tAkt = total Akt.
Figure 3
Figure 3. Dose–response effects of insulin on pAkt–tAkt response
Average densitometric quantification of the dose-dependent responses of the pAkt–tAkt ratio to insulin stimulation under normal sleep and sleep restriction. Because of insufficient volume of biopsy sample, insulin concentrations of 0.25, 0.50, and 0.75 nM (under sleep restriction) and 0.50 nM (under normal sleep) in participant 6 and 10.00 nM (under normal sleep) in participant 3 were omitted. Note that pAkt and tAkt are measured using different antibodies; thus, the pAkt–tAkt ratio can vary outside of the range of 0% to 100%. Error bars are SEs of the mean. pAkt = phosphorylated Akt; tAkt = total Akt.
Appendix Figure
Appendix Figure. tAkt response across all insulin concentrations
Average densitometric quantification of the tAkt densities across all insulin concentrations under normal sleep and sleep restriction. Because of insufficient volume of biopsy samples, insulin concentrations of 0.25, 0.50, and 0.75 nM (under sleep restriction) and 0.50 nM (under normal sleep) in participant 6 and 10.00 nM (under normal sleep) in participant 3 were omitted. Because the volume of fat biopsy from our lean participants was limited, we first filled the sample tubes that were going to be exposed to the nonzero insulin concentrations (0.10–10.00 nM). The sample exposed to zero insulin concentration therefore tended to have a lower cell volume, resulting in a lower tAkt value than that of all nonzero concentrations. At the zero insulin concentrations, 10 of the 14 sample tubes had 0 pAkt values. No significant changes occurred in tAkt levels across all 8 insulin concentrations for either sleep condition (analysis of variance for repeated measures with insulin concentration as factor: normal sleep, P = 0.32; sleep restriction, P = 0.23; Greenhouse–Geisser adjusted F test). In contrast, pAkt was significantly increased with increasing insulin concentrations under both sleep conditions (normal sleep, P = 0.038; restricted sleep, P = 0.014; Greenhouse–Geisser adjusted F test). Differences between sleep conditions in mean tAkt levels (across all insulin concentrations, including the zero concentration) were also nonsignificant (tAkt level, 47.7 [SD, 14.3] during normal sleep vs. 54.7 [SD, 23.6] during restricted sleep; mean difference, +6.96 [SD, 10.9]; P = 0.14. Error bars are SEs of the mean. pAkt = phosphorylated Akt; tAkt = total Akt.

Comment in

Similar articles

Cited by

References

    1. Hobson JA, Pace-Schott EF. The cognitive neuroscience of sleep: neuronal systems, consciousness and learning. Nat Rev Neurosci. 2002;3:679–693. [PMID: 12209117] - PubMed
    1. Stickgold R. Sleep-dependent memory consolidation. Nature. 2005;437:1272–1278. [PMID: 16251952] - PubMed
    1. Wang G, Grone B, Colas D, Appelbaum L, Mourrain P. Synaptic plasticity in sleep: learning, homeostasis and disease. Trends Neurosci. 2011;34:452–463. [PMID: 21840068] - PMC - PubMed
    1. Beihl DA, Liese AD, Haffner SM. Sleep duration as a risk factor for incident type 2 diabetes in a multiethnic cohort. Ann Epidemiol. 2009;19:351–357. [PMID: 19362278] - PubMed
    1. Cappuccio FP, D’Elia L, Strazzullo P, Miller MA. Quantity and quality of sleep and incidence of type 2 diabetes: a systematic review and meta-analysis. Diabetes Care. 2010;33:414–420. [PMID: 19910503] - PMC - PubMed

Publication types