

The limitations of simple gene set enrichment analysis assuming gene independence
- PMID: 23070592
- PMCID: PMC3758419
- DOI: 10.1177/0962280212460441
The limitations of simple gene set enrichment analysis assuming gene independence
Abstract
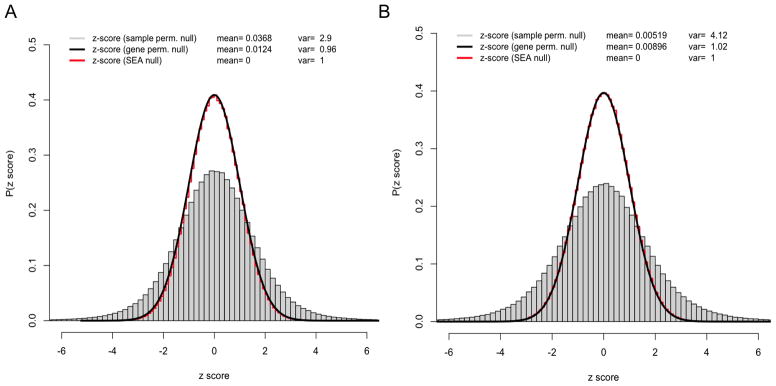
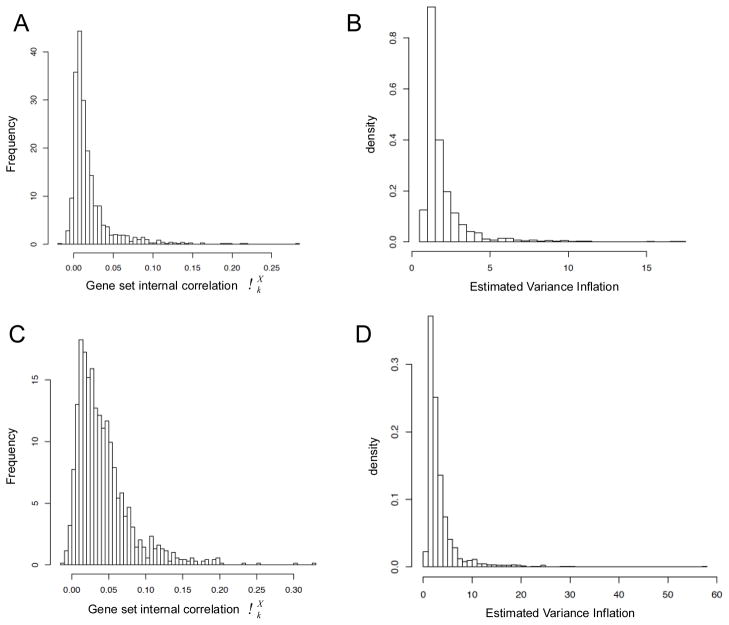
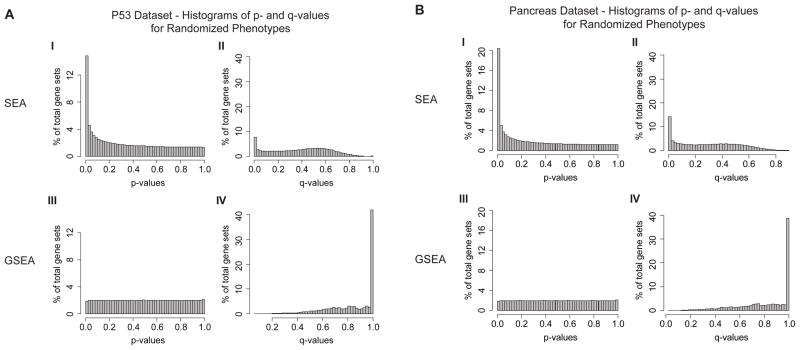
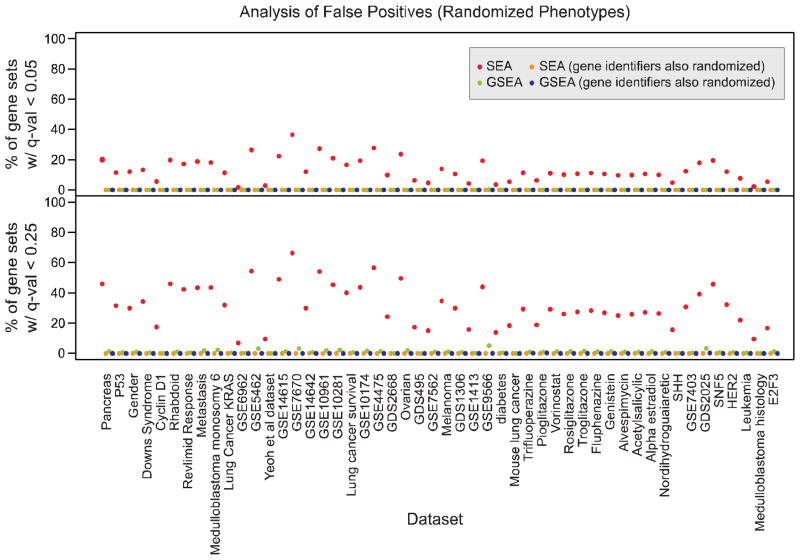
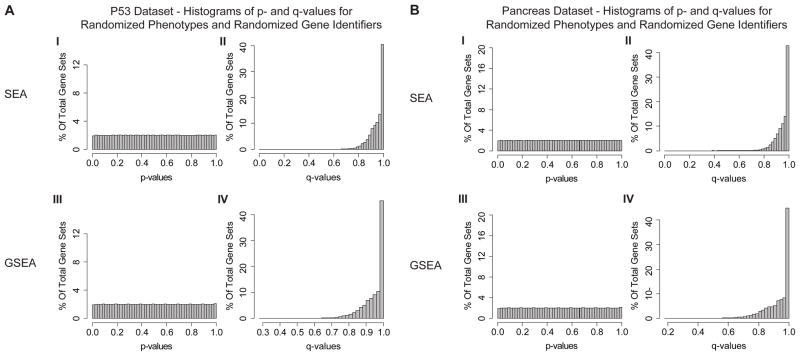
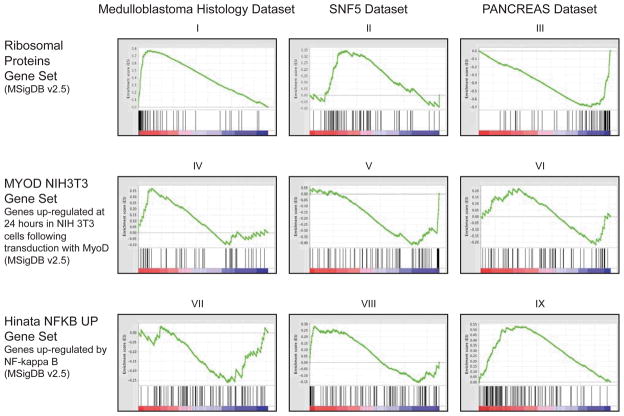
Since its first publication in 2003, the Gene Set Enrichment Analysis method, based on the Kolmogorov-Smirnov statistic, has been heavily used, modified, and also questioned. Recently a simplified approach using a one-sample t-test score to assess enrichment and ignoring gene-gene correlations was proposed by Irizarry et al. 2009 as a serious contender. The argument criticizes Gene Set Enrichment Analysis's nonparametric nature and its use of an empirical null distribution as unnecessary and hard to compute. We refute these claims by careful consideration of the assumptions of the simplified method and its results, including a comparison with Gene Set Enrichment Analysis's on a large benchmark set of 50 datasets. Our results provide strong empirical evidence that gene-gene correlations cannot be ignored due to the significant variance inflation they produced on the enrichment scores and should be taken into account when estimating gene set enrichment significance. In addition, we discuss the challenges that the complex correlation structure and multi-modality of gene sets pose more generally for gene set enrichment methods.
Keywords: Gene set enrichment analysis; gene expression.
© The Author(s) 2012.
Figures
References
-
- Pavlidis P, Lewis DP, Noble WS. Exploring gene expression data with class scores. Pac Symp Biocomput. 2002:474–485. - PubMed
-
- Gerstein M, Jansen R. The current excitement in bioinformatics-analysis of whole-genome expression data: how does it relate to protein structure and function? Curr Opin Struct Biol. 2000;10:574–584. - PubMed
-
- Mirnics K, Middleton FA, Marquez A, Lewis DA, Levitt P. Molecular characterization of schizophrenia viewed by microarray analysis of gene expression in prefrontal cortex. Neuron. 2000;28:53–67. - PubMed
-
- Zien A, Kuffner R, Zimmer R, Lengauer T. Analysis of gene expression data with pathway scores. Proc Int Conf Intell Syst Mol Biol. 2000;8:407–417. - PubMed
Publication types
MeSH terms
Grants and funding
LinkOut - more resources
Full Text Sources
Other Literature Sources
